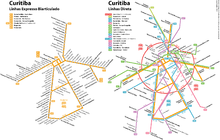
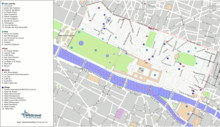
Map
A map is a simplified graphic representation of a territory with metric properties on a two-dimensional surface that can be flat, spherical or even polyhedral. The metric properties of the map depend on the projection used, and make it possible to take measurements of distances, angles or surfaces on it and their relationship with reality, in some cases applying known coefficients for the correction of the measurements.
Initiated with the purpose of knowing the world, and supported primarily by philosophical theories, maps are today an important source of information and a large part of human activity is related in one way or another to cartography.
Currently, there is still concern and the need to continue with the never-finished cartographic work. The universe in general —and the solar system in particular— will undoubtedly offer new terrain for this work that has immemorial origins.
The use of techniques based on orthophotography has made it possible not only to know the exact outline of a country, a continent, or the world, but also ethnographic, historical, statistical, hydrographic, orographic, geomorphological, geological, and economic that lead man to a broader knowledge of his environment, of the planet on which he lives.
The history of cartography ranges from the first traces in the sand or snow, to the use of geodetic, photogrammetric and photo-interpretation techniques. The geometric errors of a map usually remain below what the human eye can perceive, and it is common to put the limit of human visual perception at 0.2 mm.
The essential point in making a map is that the graphic expression must be clear without sacrificing accuracy. The map is a document that has to be understood according to the purposes that intervened in its preparation. Every map has a hierarchical order of values, with the primaries standing out above the secondaries.
In order to meet these requirements, the cartographer can create several "reading planes". Simplification techniques, based on colors or symbols, must be kept in mind at all times, without losing sight of the fact that in a deeper reading level, detailed information elements can be obtained. The amount of information should be related proportionally to the scale. The greater the space dedicated to a region, the greater the number of information elements that can be provided about them.
In short, all maps must include a synthesis of the whole as well as an analytical detail that allows a deeper reading. The level at which these conditions are met will also be the level of cartographic quality of a given map.
History of cartography
It seems that all primitive peoples have had some form of rudimentary cartography, often expressed by what might be called ephemeral cartography: mere momentary traces in the sand, damp earth, or other elements. Perhaps these have not gone beyond a simple arrow indicating direction between two points, but even so they can be considered as a first cartographic sketch.
The natives of the Marshall Islands were already making prehistoric proto-maps with shells on palm lattices, representing "marine charts" and indicating the curvature of the wave fronts. It is also worth noting as antecedents the primitive letters elaborated by Eskimos on the hydrography of the regions they inhabited.
Babylon and Greece
The oldest known maps are Babylonian tablets from about 5,000 years ago. However, the first scientifically based maps come from Greece, and are based on trying to faithfully reproduce information provided by various travelers, trying to combine this information. It is claimed that Tales of Miletus made the first world map in which the World is conceived as a disc that floats on the waters. Aristotle was the first to measure the angle of inclination with respect to the equator, which later allowed us to deduce the sphericity of the Earth and even the existence of tropical zones and polar caps. Hipparchus (II century BC) first established the mathematical conventions that allowed the characteristics of the spherical surface to be transferred to a plane, that is, he made the first cartographic projection.
Eratosthenes (284 BC-192 BC) established the first measurements of the Earth. He obtained the radius of the terrestrial angle and from there the longitude of the Earth, that of the meridian and the terrestrial circumference (very close to the real one). Between him, Ptolemy and others change the conception of the Greeks about the Earth, establishing that it is not flat, but curved.
Ptolemy (2nd century AD) collected all the knowledge of his predecessors and presented the first comprehensive overview of cartographic progress achieved up to his time. He published a method about the determination of coordinates based on meridians and parallels. With the work of Ptolemy began the opportunity to know the world in a new way: through maps.
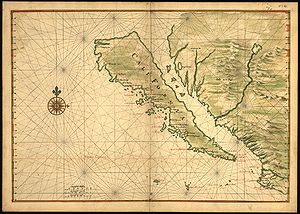
After Ptolemy's work, for many centuries cartography virtually stagnated, so sailors navigated using makeshift maps, until the discovery of the compass allowed the first portolans to be made. Among these maps, resulting from experience, it is worth noting those of the Italian, Catalan, Portuguese, Venetian, French and mainly Majorcan schools. The voyages of the Venetians and Genoese to the interior of Africa and the great journeys of the Portuguese and Spanish along the coasts of that continent -and later of the American one- gave a new and great impetus to cartography.
In America
In Mexico, the indigenous chiefs, according to Hernán Cortés, had geographical maps made of maguey paper and skins, as well as cotton, henequen and palm fabrics, on which they were drawn with vegetable colors and sometimes they were given a finished with varnish. These maps reproduced itineraries and specific areas. It is considered that the Spanish added to the existing maps notes in Spanish, substituting the footprint of the bare foot for a horseshoe to indicate the roads that could be traversed on horseback. The representation of Catholic temples was also added by means of crosses and later ideograms that symbolized fountains, canals and aqueducts.
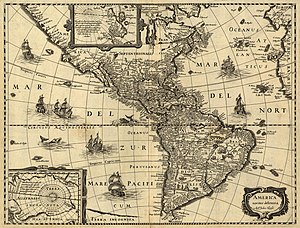
At the time of the discovery of America, great cartographers such as Diego Méndez, Juan de la Cosa, Pedro and Jorge Reinel, Sebastiano Caboto, Oronteus Finaeus, Desceliers and, in a very special way, Gerardus Mercator, who in 1569 used for the first time once the projection canvas. As a curious fact, it is said that Amerigo Vespucci, who received the great distinction of naming the New World, was actually an outstanding but not exceptional cartographer, and the perhaps undeserved honor that was done to him was due to the fact that a publisher who published the first maps of the new lands pointed to these as "tierras de Americo" and the name became irreversibly popular. The Mercator projection system can be considered as the most important achievement in the history of cartography, before the XX century the new techniques of aerial photography and, later, from satellites were imposed.
Amerigo Vespucci
Américo Vespucio (1454-1512) was a navigator who worked in the service of Portugal and the Crown of Castile; he was considered the first European to understand that the lands discovered by Christopher Columbus formed a new continent. For this reason, the cartographer Martin Waldseemüller used the name America as a designation for the New World on his 1507 map. Vespucci began to draw up the maps of his travels around the American continent once installed in Seville (1508), at the service of King Ferdinand. Both Solís and Pinzón, Juan de la Cosa and Vespucio contributed with their expeditions to drawing up the first known maps of the American continent. Likewise, the so-called planispheres of Salviatti and Castiglione, both from around 1525, are important cartographic documents of the time, on which later maps were based. Castiglione's planisphere was given to him by Emperor Charles V. Waldseemüller's map, printed on 12 separate sheets, was one of the first to clearly separate North and South America from Asia.
Abraham Ortelius
In the 16th century many cartographers produced maps that incorporated the increasing information provided by navigators and explorers. Abraham Ortelius, a Flemish cartographer born in 1527, became a famous mathematician before turning his activity to geography and cartography. In 1570 he published his Theatrum Orbis Terrarum , the first modern atlas, a work considered the first immediate commercial success of its kind. Currently, the classification and structure of this is still used. The first version of it contained 70 maps (56 from Europe, 10 from Asia and Africa, and one from each continent). He made a selection of the best available maps, which he redraw in a uniform format for the edition of his work, and established a logical order of the maps: world map, Europe, Asia, Africa and New World. He also included a list with the names of the map authors. This atlas was very successful, especially for its size and format; It was published in several languages, and it did not stop being updated and improved until 1612. In 1575 Ortelius was appointed geographer to Felipe II, a position that allowed him access to the knowledge accumulated by the Portuguese and Spanish explorers.
Gerhardus Mercator
The German-Dutch geographer and cartographer Gerhard Kremer, called in Latin Gerhardus Mercator (1512-1594), a native of the Netherlands, studied philosophy and mathematics in his youth, soon becoming an eminent cartographer; among others, he carried out work for Emperor Charles V. However, in the 1540s he was accused of heresy and imprisoned for some time. He then moved to Duisburg, in the duchy of Cleves, where many persecuted Dutch Protestants also settled.
In 1554 he became internationally famous for a large map of Europe. On a world map of the year 1569 he used the map projection system that was later named after him. It is a cylindrical representation with straight and parallel meridians and equal circles of latitude, and it has the advantage that the lines that join two points maintain a constant course, which facilitated navigation by compass. In the world map of Mercator, referred to Cartesian coordinates, the parallels are lines parallel to the axis of the abscissa, the equator being represented by said axis, and the meridians are lines parallel to the axis of the ordinates, the origin meridian being represented by said axis.; moreover, the poles are not representable on the map. The Mercator map projection is thus a direct rectangular cylindrical projection in which the parallels are lines that preserve distances. The value of the modulus of linear deformation increases with latitude towards the north pole or towards the south pole, being infinite at both poles. Equidistant parallels on the terrestrial sphere thus correspond, on the map, to increasingly distant lines. Loxodromia on Earth (lines that intersect all meridians at a constant angle) are represented on this map by lines. Only the Mercator projection enjoys this property.
The use of this cartography is general in marine navigation, because it allows finding the route angle by simple graphic procedures. However, on this map the scale varies very quickly, especially at high latitudes, so it is always convenient to give the scale of the Mercator map for a certain reference parallel, which can be the equator, or for the mean parallel. of the map. The first year after Mercator's death his great book of world maps was published. He had named it Atlas, in honor of the giant in Greek mythology that supported the celestial vault, and since then major works of cartography have been called that. Subsequently, the famous cartographer and copper engraver Jodocus Hondius perfected and republished Mercator's Atlas.
Mercator is still considered one of the greatest cartographers of the Age of Discovery; the projection that he conceived for his world map was invaluable to all navigators. The accuracy of later maps was greatly increased due to more precise determinations of latitude and longitude and calculations of the size and shape of the Earth.
Magnetic Declination and Currents
The first maps showing magnetic declination angles were made in the first half of the 17th century, and the The first charts showing ocean currents were made around 1665. In the 17th century the scientific principles of cartography and Most notable inaccuracies in the maps are confined to parts of the world that had not been explored.
French contribution (18th century)
At the end of the XVII century the astronomical determinations made in different parts of the world and, in particular, in East Asia, they were sufficiently numerous so that the errors that disfigured them were no longer preserved on the maps. False and true data, mixed for centuries, formed a labyrinth in need of a total review. The French geographer Guillermo Delisle (1675-1726) published in 1700 a world map that placed the eastern regions of the ancient continent in their place and with correct dimensions. Jean Baptiste Bourguignon d'Anville was 29 years old when Delisle died in 1726. He professed an almost innate vocation for geography, since as a child it was his game and his distraction. Then it was his constant concern and his lifelong thought of him. He dedicated to her all his studies and her qualities, together with an undeniable artistic taste. At the age of 22, he became known for a series of maps of France, productions that already had an original seal that always distinguished his later works.
The French Academy of Sciences worked to perfect astronomical and mathematical geography and sent isolated travelers or commissions to different parts of the Globe. Some, like Ridrer, who went to the island of Cayenne in 1672, to solve the problem of terrestrial physics, and others, like M. De Chazelles, in 1694, to determine the latitude and longitude of some important positions in the interior. of the Mediterranean, in order to dispel some doubts that remained about the length of this sea so poorly represented according to Ptolemy's data. Others went to Lapland and Peru, to measure two meridian arcs at the same time, one beyond the Polar circle and the other close to the equator. In this way, the accuracy of the Newtonian theory about the flattening of the terrestrial globe was verified.
Both the operations in Lapland, carried out from 1735 to 1737 by Clairant and Maupertuis, and those in Ecuador, from 1735 to 1739 by La Condamine, Godin and Bouguer, accompanied by Antonio de Ulloa and Jorge Juan, confirmed the theoretical deductions and revealed the progressive increase of the terrestrial degrees from the equator. Colbert asked the Academy of Sciences for the geometric description of the kingdom and Cassini de Thury, director of the Observatory and grandson of the great astronomer, conceived a cartographic projection that bears his name. In 1744 he began the first operations, aided by his son, many astronomers and about thirty skilled planners. This work was completed in 1773 and served as a model for similar projects carried out in other countries.
Towards the end of the 18th century, when the spirit of exploration waned and nationalism began to develop, a large number of countries Europeans began to undertake detailed topographical surveys at the national level. The first complete topographical map of France was published in 1793, roughly square in shape and measuring approximately 11m on a side. The UK, Spain, Austria, Switzerland and other countries followed suit. In the United States, the Geological Survey ("geological study") was organized in 1879 in order to make large-scale topographic maps throughout the country. In 1891, the International Congress of Geography proposed to map the entire world at a scale of 1:1,000,000, a task that has not yet been completed.
Cartography in the 20th century
In the 20th century, cartography underwent a number of important technical innovations. Aerial photography was developed during World War I and was used more widely in orthophoto mapping during World War II. Launching the PAGEOS satellite in 1966 and continuing into the 1970s with three Landsat satellites, the United States conducted comprehensive geodetic surveys of the Earth's surface using high-resolution photographic equipment attached to those satellites. Despite great technical advances and cartographic knowledge, studies and topographic and photogrammetric surveys of large areas of the earth's surface that have not been studied in detail remain to be carried out.
At the beginning of the XX century, about 5% of the earth's surface remained unexplored. It was not until the second half of this century that the exploration of practically the entire Earth was achieved with the help of artificial satellites.
For modern photogrammetry, high-precision instruments are used that allow aerial and satellite photographs to be related to real measurements of the terrain. This results in graphic information that makes it possible to know the distances and slopes of a given region. Photointerpretation, through the stereoscopic vision of photogrammetry or aerotopography, gives a high level of detail, which makes it possible to reach true conclusions about the conditions of the soil, its current and potential uses.
On the other hand, the appearance of Geographic Information Systems (GIS) in the 70s and its popularization in the 90s have revolutionized the way of creating and managing cartography through these computer tools that associate spatial elements with bases. of data. GIS allow the analysis and management of the territory through digital cartography in a fast and effective way.
Currently, mapping is a complex operation involving groups from more than 50 different disciplines: photonavigators, mechanics, laboratory chemists, surveyors, mathematicians, topographers, geologists, biologists, geographers, physicists, agronomists, soil scientists, civil engineers, economists and architects, among others.
There were those who thought that cartography would stagnate once the surface of each region of the Earth was mapped. However, there are serious plans to make maps of the neighboring planets of the solar system, so that the maps, which were the initial way of knowing the Earth, will very soon serve to push the frontiers of knowledge beyond the planet on which we live..
Map types
- Map on lost margin: totally partial map without margin in such a way that the mapped space reaches the limit of the sheet.
- Current map: map that represents the most recent topographic and geographical data.
- Administrative map: map that represents the main facts of the administrative organization of a territory, especially issues relating to borders, divisions and capitals.
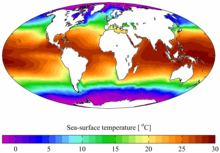
- Analytical map: Thematic map that represents the elements of a phenomenon.
- Map: map in which the territories are modified in order to ensure that their surfaces are proportional to the magnitudes of a phenomenon to be represented, ensuring that the contiguity and configurations of the territories are maintained.
- Auxiliary map: map attached to another that complements it. Note: It is usually placed on the same sheet and is usually represented on a different scale, which is usually smaller.
- Adjacent auxiliary map: auxiliary map that represents, generally on the same scale, an area adjacent to that of the main map.
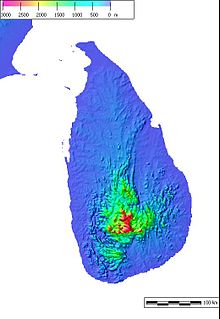
- Batimetric map: hydrographic map representing the relief of submerged areas.
- Base map: map reproduced entirely or partly in one or several colors that serves to overlay in it thematic data.
- Base map: initial map resulting from a topographical or photogrammetric survey. For example: the state topographic map. It is usually a large-scale official document that subsequently forms the rest of the maps. It is an opposite concept to the derived map.
- Catastral map: map that represents the limits of land ownership. Complementary synonym: catastral plane.
- Key map: See: map index.
- Continental map: map that represents a whole continent, usually on a scale of between 1:20.000.000 and 1:50.000.000.
- Chochromatic map: map in which qualitatively different areas are marked by means of plots or colors.
- Court map: topographic map developed on a small enough scale to represent large groups of the territory of a region, a group of regions or a continent.
- Choir map: Thematic map that represents the spatial distribution of a phenomenon by means of plots or different shades of color or gray, in which the gradation of intensity expresses different intervals of a phenomenon in territorial, administrative or conventional units.
- Current map: map that represents the speed and direction of marine currents.
- Map of cotas: See: Tape sheet.
- grid map: map that has an overlapping grid or indicated in its frame.
- Map of batimetric curves: batimetric map that represents the relief of the underwater depths by using isobaths.
- Level curve map: map that represents a relief through level curves.
- Qualitative map: Thematic map that represents the distribution of phenomena according to their nominal or conceptual character.
- quantitative map: Thematic map that represents the distribution of phenomena and facts according to their numerical importance expressed in an absolute or relative way. They usually wear legends.
- dasimetric map: map of chorpletas in which the statistical areas are subdivided into areas of relative homogeneity based on complementary information. Note: is a map used primarily to represent population densities.
- Road map: map that mainly represents the roads, which are classified in categories according to their road importance.
- Map of star: planisferium that represents the surface of a star-shaped balloon. In this type of map the projection has been made from two different mathematical definitions, which are usually one for the central part and the other for the tip of the star.
- Railroad map: itinerary map that represents the railway network, stations and attachments and railway infrastructures or that are of interest to users.
- Flow map: Thematic map that represents the direction of movement through variable width lines, proportional to its importance and schematic according to the layout. Complementary synonym: flow line map. Provide complex data through lines that are born and reach certain places. It is a type of complex map by the volume of information, by the way it is presented and by the different relationships that can be established.
- Franjas Map: Thematic map in which the surface of each territorial unit has been divided into parallel and surface strips proportional to the sectoral values of the represented phenomenon.
- Frequency map: Thematic map that represents the number of times a fact or phenomenon manifests in a particular area or place.
- Hustle map: map that represents its field by means of a few husos that are normally joined in the points of the equator or in the poles.
- Time map: planisferio that represents the time zones.
- Intensity map: Theme map that represents phenomena according to the degree of force or activity.
- Map of isopletas: map that represents the variations of a phenomenon by using isopletas.
- Map of the Moon: map that represents the surface of the Moon.
- Line map: map that has its graphical representation made from lines.
- Airline map: itinerary map that represents the routes of the regular airlines.
- Flowline Map: See: flow map.
- Maritime Navigation Line Map: itinerary map that represents regular sea routes and often also rivers.
- Map of Mercator: map set in the Mercator projection.
- Normal map: map that represents a relief by normal.
- Guidance map: map that represents selected topographic elements in order to be able to perform a quick and simple interpretation of the location itself and of other significant elements or places. It is used to follow some route.
- Outstanding map: Thematic map that, through any graphic system, represents the different degrees of slope of a territory.
- Map of forecast: map that represents the likely situation or evolution of the phenomena determined for a period or a future date.
- Map of points: quantitative thematic map in which the distribution of an object or phenomenon is represented by points.
- Situation map: map, usually on a small scale, indicating the situation of an area or a map sheet within a larger territory.
- Surface map: See: map of surface time.
- Map of batimetric inks: batimetric map depicting submerged areas by different color graduations.
- Hypometric ink map: topographic map that represents height through different color graduations.
- Relative topography map: map of the time that represents the thickness or differences of altitude between two levels of pressure.
- Map of the sky: See: Planisferio celeste.
- Map of the world: map that represents all or most of the Earth's surface.
- Map of the relief: an orographic map that represents the relief through various methods that are usually of plastic effect.
- Time map: map that represents the values of some meteorological elements, especially pressure, atmospheric phenomena and fronts at a given time.
- Map of altitude time: map of the time it represents, by means of isohipsas, the heights in which there is a certain pressure and, by isotermas, the temperatures at these heights.
- Surface time map: map of the time it represents, basically, reduced surface pressures at sea level, using isobaras, with its value and the symbol of the main configurations and fronts.
- Densimetric Map: Thematic map that represents the distribution of a fact or a phenomenon with quantitative data referring to a surface unit.
- Map derived: map that has been obtained from a map considered principal, with or without reduction of the scale, directly from one or several base maps or from other derivative maps. Note: is an opposite concept to the base map.
- Diagram map: See: Cartodiagram.
- Bar diagram map: Thematic map that represents a fact or phenomenon distributed territorially by one or more height bars, being these proportional to the value to be represented.
- Map of squares: Thematic map that represents the surface of each territorial unit divided into squares that are covered by different plots or colors, so that the number of squares of each type is proportional to the partial values of the phenomena represented.
- Learning map: map developed for instructive purposes.
- Dynamic map: also known as map animation.
- Map in black and white: monochrome map that has been printed in black, or gray values, on a white background.
- Map in the text: printed map in the body of a text, an article or a book. Note: It is an opposite concept to map out of text.
- Map in gray: monochrome map printed in soft grey, using the color as both background and work base.
- Perspective map: map in which a perspective has been used for the representation of a territory.
- Map in relief: topographic map developed in three dimensions.
- School map: educational map developed and prepared to be used in schools.
- Schematic map: map with a very simplified cartographic representation.
- Statistical map: Thematic map that represents statistical data, usually from political and administrative territorial units.
- Exaggerated map: map that represents certain phenomena in such a way that they acquire more importance than they actually have.
- Map facsimil: map that faithfully reproduces an ancient map.
- Fantastic map: map that represents objects and phenomena that are nonexistent or that are not located in the form and characteristics in which they are expressed.
- Phenological map: Thematic map that represents the seasonal or periodic manifestations of living beings. Example: a map of whale migration.
- Physical map: map, usually on a small scale, which represents the main physiographic features of a territory.
- physiographic map: morphographic map that represents the characteristics of the relief to great features of a figurative and simplified form using an oblique perspective.
- Out-of-text map: loose map that accompanies a text, a book or an article. Note: It is an opposite term of map in the text.
- General map: map that represents a set of basic and diverse geographical phenomena such as coasts, hydrography, relief, populations, roads, administrative boundaries, toponymy, etc. Note: Large-scale general maps of land areas are often called topographic maps. Some and others are usually considered complementary and opposed to thematic maps.
- Geological map: Thematic map depicting rocks and geological structures observable on the Earth's surface. Lithology and age of rocks are represented codified by standardized colors and plots. The symbol indicates the inclination of the layers, the shafts of the folds, the faults, etc. They are usually accompanied by geological cuts and stratigraphic columns.
- Geomorphological map: Thematic map that represents the forms of relief according to its genesis, the dimensions, the types and their relations with the structure and its dynamics. Synonym complementary: morphological map.
- Geopolitical map: map which, by appropriate symbolism, represents theories and facts of geopolitics.
- Hydrographic map: map that mainly represents the courses of rivers and surfaces with water.
- Hypometric map: map that represents, fundamentally, the altitude of a territory.
- Historical map: Thematic map that represents historical events and phenomena.
- illustrated map: map in which drawings or photographs are used instead of cartographic symbols.
- Unbeatable map: ancient map printed in the early times of the existence of the printing press.
- Independent map: map that constitutes a bibliographic unit with a single theme or title.
- Index map: general map where the different maps included in a series or atlas are schematically located and where the page or location reference is indicated. Complementary synonym: Map key.
- Interactive map: cartographic representation developed in computer environments that combine the map with the interactivity capacity on it.
- Inventory map: a map that exhausts the geographical distribution of a particular phenomenon.
- Map itinerary: map that represents the network of communication channels and in which the distances between the different key points are normally added.
- Map: map developed in such a way that it is enigmatic and difficult to decipher.
- Mental map: cartographic image of a territory, more or less distorted, that has in thought.
- Mining map: large-scale map that represents the situation and extent of a mining area in which both its external topographic forms and its underground structures are described. Note: A series of cuts or vertical sections often complete the cartographic information.
- Monochrome map: printed map in a single color.
- Municipal map: It is the map of a geographical region where a president or edil performs his functions as a government, dependent on a state, and this in turn from a country.
- Morfographic map: Thematic map that represents the forms of a land according to its aspect.
- Morphological map: See: geomorphological map.
- Morphometric map: Thematic map that represents the forms of a relief in a quantitative form, whether in absolute or relative values. Note: many maps of earrings are morphometric maps.
- Wall map: large-scale map that represents a very useful widespread information that can be read from a certain distance.
- Mute map: map that has neither implantation nor labelling (toponymy).
- National map: map that represents a territory of a nation or a state, usually on a scale of between 1:5,000.000 and 1:20.000.000.
- Numerical map: digital image of a phenomenon or of a geographical accident preserved in cartographic sheets, magnetic tapes, DVD-ROM or other support for your computer treatment.
- Official map: map developed by an official agency.
- Original map: map from which other maps are obtained. Note: in particular original maps are considered maps obtained by the representation of original studies.
- Map: map that represents the physical configuration of a relief using hypsometric inks, shaded or any other technique.
- Pictorial map: map depicting topographic accidents, objects or phenomena by pictorial signs rather than using the usual conventional signs.
- Pictorial map of the relief: map that represents the relief and any other topographical accident in approximate planimetric position using pictorial signs, which makes it a sensation similar to that of an oblique perspective.
- Planimetric map: topographic map in which the relief is not represented.
- Folding map: map that can be folded to facilitate your conservation and consultation.
- Pluviometric map: Thematic map that represents the amount and distribution of rainfall in a territory and in a given period of time.
- Polychrome map: printed map in different colors.
- Political map: map, usually on a small scale, which represents the political and administrative divisions of a territory that are usually differentiated using different inks for it.
- Primitive map: map made before the first topographic surveys carried out systematically and accurately.
- Main map: map which is an essential element of a cartographic sheet and is usually complemented by one or more auxiliary maps.
- Regional map: map that represents a region or part of a territory on a scale normally between 11,000,000 and 1:5,000,000.
- Synoptic map: thematic map that represents two or more types of phenomena in order to express their functional relations. For example: a map of time.
- Synthetic map: Thematic map that from a precise objective represents a phenomenon as a whole through its internal relations.
- Thematic map: map which, on an elementary topographic base of reference, stands out, using various resources of cartographic techniques, correlations, assessments or distribution structures of some specific and specific subject. Note: conventionally the topographic map and the entire general cartography are considered complementary, even opposed to the thematic map.
- Topographic map: map that represents the planimetry and altimetry of the forms and dimensions of concrete, fixed and durable elements of a particular area of the surface of a land.
- National topographic map: topographic map, usually at scale 1:50000 or 1:25000, which serves as a base map of the territory of a nation or a state.
- Transparent map: printed map on a transparent or translucent material that overlaps one or more maps that have the same field and scale with the object, mainly, to complement the information.
- Tourist map: map that includes information useful for tourism, regarding urban location and communication routes, highlighting the points of historical interest, landscape, etc.
- Urban map: map of a city.
- Rural map: map that represents a rural area with little influence of technology.
- Schematic map: in this type of maps the known base representation is not used, if not that the information is schematiced, as in this case, through different sizes of tables or rectangles according to the data and the proportion of information.
Maps that marked history
Throughout history, ways and means of showing the position of geographic phenomena have emerged. In the past, static maps, for example, served all kinds of audiences despite the diversity of map users and contexts of use. Today, digital technology has transformed the way maps reach their audience, as maps are increasingly interactive and are accessed over the Internet or on a mobile device. The new environments of use for mapping have made maps and geospatial data more accessible than ever before to more people around the world, and have needed to be adapted to the specific backgrounds, interests and needs of different audiences.
The following are some of those maps, which were cartographic milestones, the result and reflection of each time and each civilization.
Contenido relacionado
Cagayan Valley
Saint John Province
Atacama Desert


