
Economy of italy
The Italian economy is the eighth largest in the world in absolute terms according to the nominal GDP criterion. At the regional level, Italy is the third largest economy in the eurozone, behind Germany and France. In relative or purchasing power parity (PPP) terms, it is also among the largest in the world. The secondary or industrial sector has been the engine of Italian development, and the current axis of its economy. As in the economy of many European countries, the tertiary sector or service sector also has a great weight in the Italian economy. The country has also been a founding member of the European Union, the eurozone, the Organization for Economic Cooperation and Development (OECD) and the G-7 group.
In the post-war period, Italy transformed from an economy based on agriculture, which had been severely affected by the consequences of the world wars, to become one of the most industrialized nations in the world and a country leader in international trade and world exports. According to the Human Development Index, the country enjoys a very high standard of living and has the eighth highest quality of life in the world according to the European economics magazine The Economist. Italy is the third country in the world with the most gold reserves and is the third largest net contributor to the European Union Budget. The country is also well known for its influential and innovative business economic sector, which makes it a highly industrialized nation (with Italy being the second most manufacturing country in Europe after Germany), as well as having a competitive agricultural sector (Italy is the largest wine producer in the world), and for its creative designs with high-quality manufacturing in the automotive, naval, industrial, household appliance and fashion sectors. Italy is also the largest market for luxury goods within Europe (3rd worldwide) and the private wealth within the country is one of the largest in the world.
Despite these important achievements, the country's economy currently suffers from structural and non-structural problems. After experiencing strong growth in its gross domestic product (GDP) over the period 1945-1990, Italy's annual average economic growth rates over the past two decades have been below the European Union average. The slow and subsequent stagnation in Italian economic growth, and the political efforts to revive it with massive government spending from the 1980s onwards, eventually produced a severe increase in public debt. In addition, in recent years, the Italian economy (like other European countries) was hit by the Great World Economic Recession that started in 2008. In the last 8 years (since 2009), Italian GDP has decreased by 27%, going from having a GDP of 2,402,062 (2 trillion, 402 billion dollars) in 2008, to only producing 1,850,735 (1 trillion, 850 billion dollars) for the year 2016.
It should also be mentioned that Italian living standards have a considerable divide between the North and the South of the country: the average GDP per capita in the Northern Italian regions is somewhat higher than the European Union average, while that some regions and provinces of southern Italy are well below the average.
Historically, the country can be divided into three economic zones: the North is more industrialized and developed, dominated by large private companies and where the country's main financial center, Milan, is located; the Center has a situation in the European average; while the South is more agricultural, less developed at an industrial and infrastructural level, highly dependent on government subsidies, and with one of the highest unemployment rates in the country. It should be noted, however, that the underground economy is highly represented in the South, while it becomes less intense as you move towards the North. This brings the South in real economic conditions almost to the level of the Center.
History

Before the Unification of Italy, backward and patriarchal laws and systems were in force in most of the Kingdom of the Two Sicilies and the Papal States and the bourgeoisie did not exist, while in the North and in some other parts of the Center, the small kingdoms and republics that followed one another over time had established a system that promoted bourgeois commerce.
After the fall of the Western Roman Empire and the rise to power of the Lombards, in northern Italy the tradition of a certain autonomy of the municipalities had created a daring bourgeoisie and there was an economic organization favorable to capitalism, to the trade and industry. On the contrary, in the South, the patriarchal administrations of the different reigning dynasties from the Middle Ages had not created all this, leaving a situation that favored the emergence of the mafias phenomenon.
With the political unity of Italy and the arrival of the House of Savoy, some of the industries of the South, already in full crisis, were, little by little, dismantled (such as the Mongiana ferries, in Calabria) or closed (such as the fields of the Caserta area). Gradually, however, many industrialists from the North opened factories in the South, encountering bureaucratic difficulties due to poorly functioning institutions and problems related to organized crime. variant:small-caps;text-transform:lowercase">XIX Italy's industrialization process has been irregular: the north has traditionally been more industrialized and has had higher per capita income, while the south was more rural (although until 1880 the three main cities were Naples, Rome and Palermo), more dependent on agriculture, poorer and more conservative.
Industrialization was largely interconnected with the artisan sector and was located in the former political capitals of pre-unitary Italy, while large factory industry was drawn to the waterfalls of the subalpine northwest. Starting in the 1880s, as modernization accelerated, Italian industries were concentrated in the northwestern regions of Lombardy and Piedmont, with a boom in the mechanical engineering and textile sectors, especially in the cities of Turin. and Milan, and with the Liguria region, and above all with the city of Genoa, which became an important industrial pole for civil and military shipbuilding.
The spread of the industrialization process that characterized the north-western parts of the country from the 1880s, completely excluded large areas in North-East, Central and South Italy. You might think that Italian emigration was a consequence of all this, but in reality it was mainly due to new immigration laws and the large number of ocean liners leaving the ports of several large Italian cities daily. The emigration affected almost 26 million Italians. Most of the Italians would emigrate during the period between 1880 and 1914, going mainly to the United States, Argentina and Brazil, and giving rise to what is considered one of the largest mass migrations of contemporary times. During World War I Worldwide, the Royal Italian Army increased in size, entering service during the war with a total of 5 million soldiers. This came at a terrible cost in human lives, as by the end of the Great War Italy had lost around 700,000 soldiers. and had a budget deficit of billions of lire.
Fascist Era (1922-1945)

Italy emerged from World War I in a poor and weakened condition. Benito Mussolini's National Fascist Party came to power in 1922, at the end of a period of serious social unrest. However, once Mussolini gained a firmer grip on power, laissez-faire and free trade were progressively abandoned in favor of government intervention and protectionism. The chart below compares the evolution relative to the population and the nominal and per capita GDP of Italy, from the year 1922 to the year 1945:
| Year | GDP (PPA) | GDP per capita (PPA) | Total |
|---|---|---|---|
| 1922 | US$ 2,394 | 38.086,000 inhabitants | |
| 1923 | US$ 2.560 | 38,460,000 inhabitants | |
| 1924 | US$ 2.575 | 38.810,000 inhabitants | |
| 1925 | US$ 2,696 | 39.165,000 inhabitants | |
| 1926 | US$ 2.662 | 39.502,000 inhabitants | |
| 1927 | US$ 2,559 | 39.848,000 inhabitants | |
| 1928 | US$ 2.664 | 40,186,000 inhabitants | |
| 1929 | US$ 2,741 | 40.469,000 | |
| 1930 | US$ 2,619 | 40.791,000 inhabitants | |
| 1931 | US$ 2,589 | 41.131,000 inhabitants | |
| 1932 | US$ 2,647 | 41.431,000 inhabitants | |
| 1933 | US$ 2,619 | 41.753,000 inhabitants | |
| 1934 | US$ 2,613 | 42.093,000 inhabitants | |
| 1935 | US$ 2,755 | 42.429,000 | |
| 1936 | US$ 2,658 | 42,750,000 inhabitants | |
| 1937 | US$ 2,925 | 43.068,000 inhabitants | |
| 1938 | US$ 3,010 | 43.419,000 | |
| 1939 | US$ 3.196 | 43.865,000 inhabitants | |
| 1940 | US$ 3.131 | 44.341,000 inhabitants | |
| 1941 | US$ 3.074 | 44.734,000 inhabitants | |
| 1942 | US$ 2,907 | 45.004,000 inhabitants | |
| 1943 | US$ 2,471 | 45,177,000 inhabitants | |
| 1944 | US$ 2.004 | 45.290,000 inhabitants | |
| 1945 | US$ 1,807 | 45.442,000 inhabitants |
The Great Depression of 1929 (with worldwide consequences) came to hit Italy's economy very hard. Trying to manage the crisis, the Fascist government nationalized the holdings of large banks that had accumulated important industrial assets, establishing the Istituto per la Ricostruzione Industriale. A series of mixed entities were formed, the purpose of which was to bring together representatives of the government and major companies. These representatives discussed economic policy and manipulated prices and wages to suit both the wishes of the government and the wishes of business.
This economic model based on a partnership between government and business soon spread to the political sphere, in what came to be known as corporatism. At the same time, the aggressive foreign policy of Benito Mussolini led to increased military spending by Italy. After the invasion of Ethiopia, Italy intervened in Spain to support Franco's nationalists in the Spanish civil war. By 1939, Italy had the highest percentage of state-owned companies after the Soviet Union.
Italy's participation in World War II as a member of the Axis Powers required the establishment of a war economy. The Allied invasion of Italy in 1943 eventually caused the Italian political structure and economy to rapidly collapse. The Allies, on the one hand, and the Germans on the other hand, simultaneously assumed the administration of the different areas of Italy, holding them under their control. At the end of World War II, Italian GDP per capita income was at its lowest point since the early XX century.
Economic Miracle of Post-War Italy

| Year | GDP (PPA) | GDP per capita (PPA) | Total |
|---|---|---|---|
| 1945 | US$ 1,807 | 45.442,000 inhabitants | |
| 1946 | US$ 2.447 | 45.725,000 inhabitants | |
| 1947 | US$ 2,915 | 46.040,000 inhabitants | |
| 1948 | US$ 3.143 | 46.381,000 inhabitants | |
| 1949 | US$ 3,413 | 46.733,000 inhabitants | |
| 1950 | US$ 3,698 | 47,105,000 inhabitants | |
| 1951 | US$ 3,983 | 47.418,000 inhabitants | |
| 1952 | US$ 4.297 | 47.666,000 inhabitants | |
| 1953 | US$ 4,698 | 47.957,000 inhabitants | |
| 1954 | US$ 4.954 | 48,299,000 | |
| 1955 | US$ 5,310 | 48.633,000 inhabitants | |
| 1956 | US$ 5.556 | 48.921,000 inhabitants | |
| 1957 | US$ 5,927 | 49.182,000 | |
| 1958 | US$ 6.301 | 49.479,000 | |
| 1959 | US$ 6,722 | 49.832,000 inhabitants | |
| 1960 | US$ 7.067 | 50.198,000 inhabitants | |
| 1961 | US$ 7,688 | 50,523,000 inhabitants | |
| 1962 | US$ 8,349 | 50.843,000 inhabitants | |
| 1963 | US$ 8,890 | 51.198,000 inhabitants | |
| 1964 | US$ 9.170 | 51.600,000 inhabitants | |
| 1965 | US$ 9,320 | 51.987,000 inhabitants | |
| 1966 | US$ 9,834 | 52.332,000 | |
| 1967 | US$ 10,632 | 52.667,000 inhabitants | |
| 1968 | US$ 11.579 | 52.987,000 inhabitants | |
| 1969 | US$ 12,317 | 53.317,000 inhabitants | |
| 1970 | US$ 12,644 | 53.661,000 inhabitants | |
| 1971 | US$ 12,908 | 5,46,000 inhabitants | |
| 1972 | US$ 13,374 | 54.366,000 inhabitants | |
| 1973 | US$ 14,271 | 54.797,000 inhabitants | |
| 1974 | US$ 14,933 | 55.226,000 inhabitants | |
| 1975 | US$ 14,703 | 55.572,000 inhabitants | |
| 1976 | US$ 15,984 | 55.839,000 | |
| 1977 | US$ 16,766 | 56,059,000 inhabitants | |
| 1978 | US$ 17.714 | 56,240,000 inhabitants | |
| 1979 | US$ 19,211 | 56.368,000 inhabitants | |
| 1980 | US$ 20,460 | 56.451,000 inhabitants |
After the end of World War II, Italy was in rubble and occupied by foreign armies, a condition that worsened the chronic gap in development towards more advanced European economies. However, the new geopolitical logic of the Cold War made it possible for the former enemy of Italy, a hinge country between Western Europe and the Mediterranean, and now a new and fragile democracy threatened by the NATO occupation forces, the proximity of the Iron Curtain and the presence of a strong communist party, it was considered by the US as an important ally and received under the Marshall plan 1,204 million dollars from 1947 to 1951.[citation required]
The end of aid through the Plan might have halted the recovery but it coincided with a turning point in the Korean War, whose demand for metal and manufactured goods was a further stimulus to Italian industrial production. In addition, the creation in 1957 of the European Common Market with Italy as a founding member, provided more investment and facilitated exports.
These favorable developments, combined with the presence of a large labor force, set the stage for spectacular economic growth that lasted almost uninterrupted until the mass strikes of " Hot Autumn " and the social unrest of 1969-70, which then combined with the subsequent 1973 oil crisis and put an abrupt end to the protracted boom. It has been calculated that the Italian economy experienced an average rate of GDP growth of 5.8% per year between 1951-63 and 5% per year between 1964-73. Italian growth rates were second, but very close to German prices in Europe, and among the OEEC countries only Japan had improved.
Foreign trade
In 2020, the country was the ninth largest exporter in the world (US$532.6 billion in goods, 2.8% of the world total). In the sum of exported goods and services, it reaches US$632.6 billion, ranking tenth in the world. In imports, in 2019, it was the tenth largest importer in the world: US$473.5 billion.
Primary sector
Agriculture


Italy produced in 2018:
- 8.5 million tons of grapes (second world producer, only surpassed by China);
- 6.9 million tons of wheat;
- 6.1 million tons of corn;
- 5.7 million tons of tomato (the world's seventh producer);
- 2.4 million tonnes of apple (global producer submission);
- 1.9 million tons of sugar beet (which serves to produce sugar and ethanol);
- 1.8 million tons of olives (second world producer, only surpassed by Spain);
- 1.5 million tons of orange (thirteenth world producer);
- 1.5 million tons of rice;
- 1.3 million tons of potato;
- 1.1 million tons of peach (second largest producer in the world, only surpassed by China);
- 1.1 million tons of soy;
- 1 million tons of barley;
- 716 thousand tons of pear (third world producer, only surpassed by China and the United States);
- 700 thousand tons of mandarin;
- 607 thousand tons of melon;
- 596 thousand tons of pumpkin;
- 581 thousand tons of watermelon;
- 562 thousand tons of kiwi (second world producer, only surpassed by China);
- 546 thousand tons of carrot;
- 389 thousand tons of alcachofa (most producer of the world);
In addition to minor yields of other agricultural products, such as pepper, cherry, eggplant, hazelnut, lemon, oats, lettuce, chicory, cabbage, onion, plum, sorghum, spinach, strawberry, sunflower, beans, etc.

The country has extremely varied agricultural exports. In 2019, the most valuable were: wine ($7 billion), processed foods ($3.6 billion), cheese ($3.5 billion), macaroni ($2.1 trillion), tomato and products made with it (U$2 billion), products made with chocolate (U$2 billion), pasta (U$1.8 billion), coffee (U$1.7 billion), tobacco and processed products with him (US$1.7 billion), olive oil (US$1.5 billion), distilled beverage (US$1.3 billion), legumes (US$1.2 billion), bacon and ham (US$0.93 billion), apple (US$0.8 billion), grape (US$0.7 billion), waffle (US$0.62 billion), rice (US$600 million), pork sausage ($0.54 billion), beef ($0.52 billion), kiwi (U$0.48 billion), feed (U$0.41 billion), plus various types of fruit juices, meat and animal milk, vegetable oils, flour, sugar, various fruits, among other products.
Faced with this, agricultural activities have experienced a considerable setback, both in employment of the active population (4%), and in their participation in GDP (2.2%). Agricultural production does not meet the food demand of the population, and is especially scarce in the livestock sector: sheep (Sardinia), pigs (Emilia-Romagna). Agriculture is more widespread, with cereal crops (wheat, rice -the first European producer-, corn), legumes, industrial plants (sugar beets), vegetables (peppers, aubergines, tomatoes and onions) and flowers. Fruit growing deserves a special mention (pears, peaches and apples in Emilia, Veneto and Campania; citrus fruits in Sicily), olives (in Liguria and the Mezzogiorno), which generates the second world oil production (435,300 t), and finally, the vine, whose cultivation places Italy at the forefront of world wine production (68.6 million hl), internationally recognized for its quality.
Livestock
In livestock, Italy was, in 2019, the fifteenth world producer of pork, with a production of 1.4 million tons; the seventeenth world producer of beef, with a production of 779 thousand tons; fifteenth world producer of cow's milk, with a production of 12.4 billion liters; the 28th world producer of chicken meat, with a production of 1 million tons; the sixth world producer of buffalo milk, with a production of 249 million liters, among others.
Secondary sector
Industry
The World Bank lists the top producing countries each year, based on the total value of production. According to the 2019 list, Italy had the seventh most valuable industry in the world ($297.9 billion).
In 2019, Italy was the 19th largest producer of vehicles in the world (0.9 million) and the 11th largest producer of steel (23.2 million tons). Italy is also one of the world's top 5 wine producers (it was the world's largest producer in 2018) and the world's fourth largest producer of olive oil.
The country is famous for its luxury brands and earns billions of dollars annually as the world's largest value aggregator. Brands like Lamborghini, Ferrari, Maserati, Dolce & Gabbana, Gucci, Fendi, Valentino Giorgio Armani, Gianfranco Ferré, Gianni Versace, Missoni give stratospheric profit margins to Italian negotiations. The country imports raw materials such as leather from the poorest countries and uses the material to make luxury clothing, luxury shoes, or luxury car leather seats, multiplying the value of the product hundreds of times.
During the initial phase of the country's industrialization, especially concentrated in the north, the main industry was the textile industry. During the XX century, other industries such as the automotive industry became important. Industrial activity has been the motor of Italian development, especially since the second half of the XX century, and the current axis of your economy.
Among the main companies in the country by sector are: Fiat Chrysler Automobiles, CNH Industrial, Ducati, Piaggio (motor vehicles); Pirelli (manufacturing tires); Enel (energy); Eni (petrochemicals); Indesit, De'Longhi (appliances); Leonardo who has absorbed Alenia Aermacchi, AgustaWestland and Oto Melara (defense); Avio, Telespazio (space); Beretta (firearms); Armani, Versace, Dolce & Gabbana, Gucci, Benetton, Prada, Luxottica, Kiton (fashion); Ferrero, Autogrill, Lavazza, Perfetti Van Melle, Parmalat (food and beverages); Techint (steel); Italcementi (constructions); Mapei (construction materials); Telecom Italia, Mediaset (communications); Assicurazioni Generali, Unipol (insurance); UniCredit, Intesa Sanpaolo (banking); Ferrari, Maserati, Lamborghini (luxury vehicles); Fincantieri (shipbuilding); Costa Crociere, Gruppo Grimaldi (ship transport); Mediaset, De Agostini, RCS MediaGroup (average); Laterza, Sellerio (publication).

.jpg)

Among its main automotive companies are:
- Abarth
- Alfa Romeo
- Ansaldo
- Aquila Italiana
- Autobianchi
- Ceirano
- Chiribiri
- Tomaso
- Ducati
- Diatto
- Ferrari
- Fiat
- Fiat Group Automobiles
- Fiat Professional
- FLAG
- Iso Rivolta
- Isotta Fraschini
- Itala (cars)
- Lamborghini
- Lancia
- Maserati
- Nazzaro
- Officine Meccaniche
- Pagani
- Piaggio
Mining
The extraction of natural resources in Italy is limited, due to the absence of large amounts of natural reserves in the country. Italy depends on imports from other countries to manufacture its industrialized products. Some expressive mineral reserves - iron, aluminum, coal, granite and phosphate - are found in the south of the country.
In general, mineral production is low and without major highlights, and it is not among the world's largest producers of almost any mineral. In 2019, the country was said to be the world's 19th largest producer of sulfur, as well as being the world's 15th largest producer of salt.
Energy

In non-renewable energy, in 2020, the country was the 40th largest oil producer in the world, extracting 100,500 barrels / day. In 2019, the country consumed 1.26 million barrels/day (the world's 17th largest consumer). The country was the world's eighth largest oil importer in 2013 (1.34 million barrels/day). In 2016, Italy was the world's 48th largest producer of natural gas, 5.7 billion m³ per year. The country was the third largest importer of gas in the world in 2011: 70.2 billion m³ per year, mainly from Russia.
In renewable energy, in 2020, Italy was the tenth largest producer of wind energy in the world, with 10.8 GW of installed capacity, and the sixth largest producer of solar energy in the world, with 21.6 GW of installed capacity. In 2019, the country was the 11th largest in the world in installed hydroelectric power capacity: 22.6 GW.
Tertiary sector
Tertiary activities have experienced the boom that characterizes developed economies: they contribute 74.4% of the active population and occupy 68.8% of GDP. The country's economic growth has brought with it the development of the financial sector, commerce, transport and various service companies, as well as a large civil service, which has become one of the heaviest burdens the country carries. Italy has a dense land transport network, complemented by large port facilities (Genoa, Trieste, Livorno, Cagliari, Gioia Tauro) and major airports (Rome-Fiumicino, Milan-Linate). The tourist sector has the attraction of its natural resources (Adriatic coast, the Riviera, the Alps and its lakes), but also historical and artistic (Florence, Pompeii, Rome, Venice), without forgetting the attraction exerted by the City of Vatican over the entire Catholic world.
Tourism
In 2018, Italy was the fifth most visited country in the world, with 62.1 million international tourists, only surpassed by Spain, France, the United States and China. Tourism revenue this year was $49.2 billion. The largest source of tertiary income is tourism: the country is an internationally known tourist pole, and its many attractions and points of interest annually attract millions of tourists from the most varied parts of the world. Tourism is the main source of income for several Italian cities such as Rome, Naples and Venice. If we count all the restaurants, hotels and shops and commercial networks, all dependent on tourism, at different levels of importance, commerce represents 17% of Italian GDP and employs more than four million people.
Roman Colosseum

Góndolas in Venice

Fontana di Trevi

Pantheon of Rome


_-_Right_side_and_front.jpg)
Ports
The 15 largest and most important commercial and tourist ports in Italy are (in order of importance):
_15_08_2019_03.jpg)
- Genoa
- Trieste
- Livorno
- Cagliari
- Gioia Tauro
- Rávena
- Venice
- Messina
- Augusta
- Naples
- I'm late.
- La Spezia
- Savona
- Salerno
- Civitavecchia
Currency
Their previous currency was the Italian lira; since January 1, 2002 it is the euro.
Historical evolution of the Italian Economy (Gross Domestic Product)
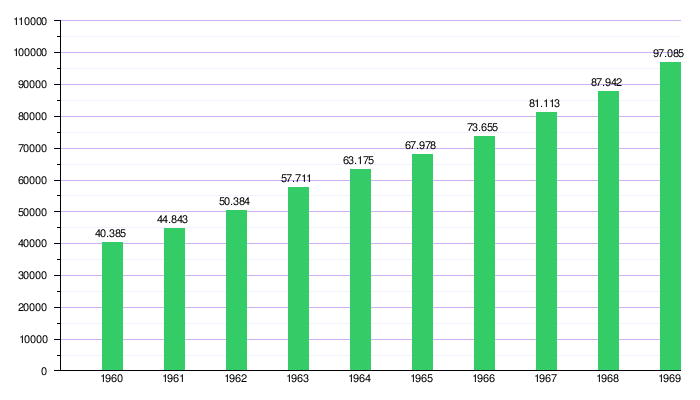
Italian Economy in the 1960s
At the beginning of the 1960s, Italy had a Gross Domestic Product (nominal) of USD 40,385 million. For the year 1969, the country's GDP reached USD 97,085 million. The Italian economy grew 140.3% during this decade compared to the GDP of 1960.
| Gross Domestic Product of Italy 1960-1969 |
|---|
 |
| Source: International Monetary Fund |
| Graphics produced by: Wikipedia |
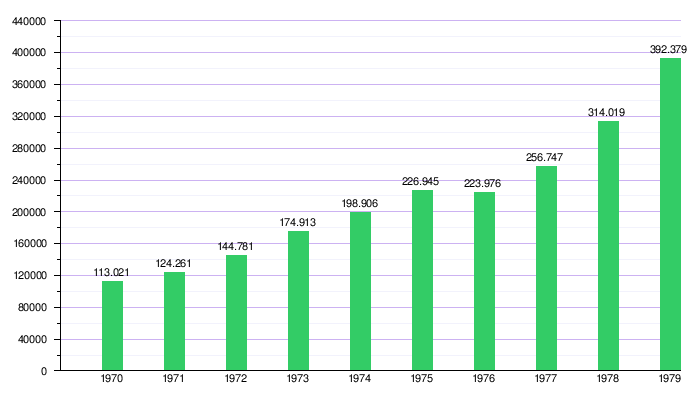
Italian Economy in the 1970s
At the beginning of the 70s, Italy had a Gross Domestic Product (nominal) of USD 113,021 million. For the year 1979, the country's GDP reached USD 392,379 million. The Italian economy grew 247.1% during this decade compared to the GDP of 1970.
| Gross Domestic Product of Italy 1970-1979 |
|---|
 |
| Source: World Bank |
| Graphics produced by: Wikipedia |
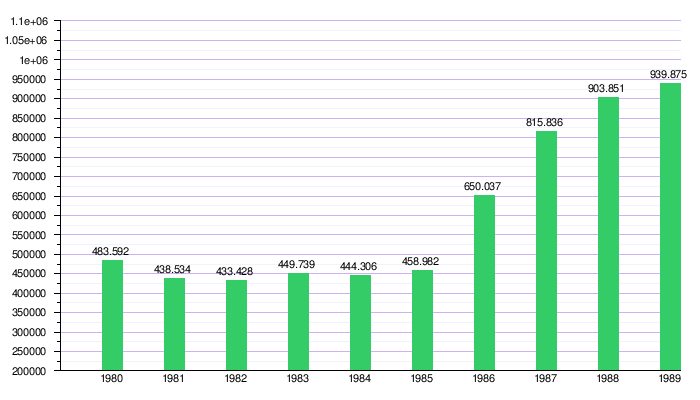
Italian Economy in the 1980s
At the beginning of the 80s, Italy had a Gross Domestic Product (nominal) of USD 483,592 million. For the year 1989, the country's GDP reached USD 939,875 million. The Italian economy grew 94.3% during this decade compared to the GDP of 1980.
| Gross Domestic Product of Italy 1980-1989 |
|---|
 |
| Source: International Monetary Fund and World Bank |
| Graphics produced by: Wikipedia |
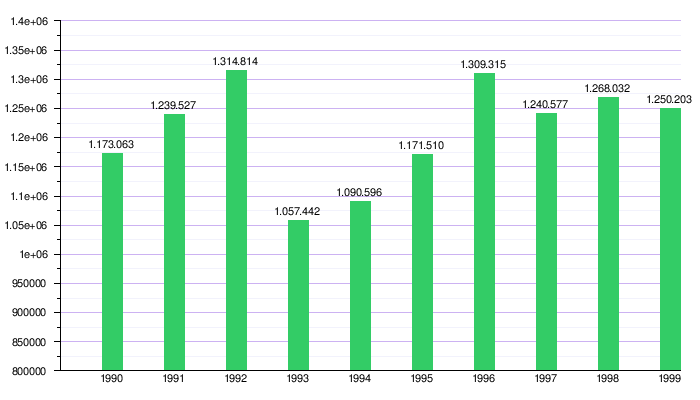
Italian Economy in the 1990s
At the beginning of the 90s, Italy reached 1 trillion dollars. The Italian economy had a Gross Domestic Product (nominal) of USD 1,173,063 (1 trillion 173,063 million dollars) in 1990. For the year 1999, the country's GDP reached USD 1,250,203 million. The Italian economy grew 6.5% during this decade compared to the GDP of 1990.
| Gross Domestic Product of Italy 1990-1999 |
|---|
 |
| Source: International Monetary Fund and World Bank |
| Graphics produced by: Wikipedia |
Italian Economy in the 2000s
At the beginning of the 2000s, Italy had a Gross Domestic Product (nominal) of USD 1,145,109 (1 trillion 145,109 million dollars). For the year 2009, the country's GDP reached USD 2,190,700 million (2,190,700 million dollars). The Italian economy had a growth of 91.3% during this decade with respect to the GDP of the year 2000. The real Gross Domestic Product (GDP) per capita increased in the period 1969-1998, in which the country had its national currency, the lira, by 104%, while in the period 1999-2016, where the country had already adopted the euro, fell by 0.75%. At the same time, since 1999, Italy's steep decline in terms of development has begun. Fiat has ceased to dominate the European car market and the country has lost its leading position as a producer of white goods. Many factories have been closed and several large companies have moved to other countries.
| Gross Domestic Product of Italy 2000-2009 |
|---|
 |
| Source: International Monetary Fund and World Bank |
| Graphics produced by: Wikipedia |
Italian Economy in the 2010s
At the beginning of the 10s, Italy had a Gross Domestic Product (nominal) of USD 2,129,020 (2 trillion 129,021 million dollars). For the year 2018, the country's GDP reached USD 2,181,970 (2 trillion 181,970 million dollars). Until now (2017) the Italian economy had a nominal growth of 2.48% during this decade compared to the GDP of 2010.
| Gross Domestic Product of Italy 2010-2017 |
|---|
 |
| Source: International Monetary Fund and World Bank |
| Graphics produced by: Wikipedia |
Historical evolution of GDP per capita
1960s
| GDP per capita of Italy in Dollars | |||
|---|---|---|---|
| Year | GDP | GDP per Capita | Population |
| Decade of 1960 (Years 60) | |||
| 1960 | USD 40,385 million | USD 802 | 50,373,900 inhabitants |
| 1961 | USD 44.843 million | USD 884 | 50,698,800 inhabitants |
| 1962 | USD 50.384 million | USD 987 | 51.060.100 inhabitants |
| 1963 | USD 57.711 million | USD 1.122 | 51.443.900 inhabitants |
| 1964 | USD 63.175 million | USD 1.217 | 51.906.800 inhabitants |
| 1965 | USD 67.978 million | USD 1.299 | 52.317,900 inhabitants |
| 1966 | USD 73,655 million | USD 1.397 | 52,720,100 inhabitants |
| 1967 | USD 81.133 million | USD 1.528 | 53.080,900 inhabitants |
| 1968 | USD 87.942 billion | USD 1.647 | 53.390,600 inhabitants |
| 1969 | USD 97.085 million | USD 1.808 | 53,685,300 inhabitants |
| Decade of 1970 (Years 70) | |||
| 1970 | USD 113,021 million | USD 2.095 | 53.958,400 inhabitants |
| 1971 | USD 124.261 million | USD 2.293 | 54,188,579 inhabitants |
| 1972 | USD 144.781 million | USD 2.653 | 54.574.111 inhabitants |
| 1973 | USD 174.913 million | USD 3.184 | 54,928,700 inhabitants |
| 1974 | USD 198.906 million | USD 3.597 | 55,293.036 inhabitants |
| 1975 | USD 226.945 million | USD 4.083 | 55,588,966 inhabitants |
| 1976 | USD 223,976 million | USD 4.010 | 55,847,553 inhabitants |
| 1977 | USD 256,747 million | USD 4.580 | 56.063,269 inhabitants |
| 1978 | USD 314.019 million | USD 5.583 | 56,247.017 inhabitants |
| 1979 | USD 392.379 million | USD 6.958 | 56,388,480 inhabitants |
| Decade of 1980 (Years 80) | |||
| 1980 | USD 483,592 million | USD 8.576 | 56,479,285 inhabitants |
| 1981 | USD 438.534 million | USD 7.765 | 56,524,064 inhabitants |
| 1982 | USD 433.428 million | USD 7.668 | 56,563,031 inhabitants |
| 1983 | USD 449,739 million | USD 7.951 | 56.565.117 inhabitants |
| 1984 | USD 444.306 million | USD 7.855 | 56,588,319 inhabitants |
| 1985 | USD 458.982 million | USD 8.111 | 56,597,823 inhabitants |
| 1986 | USD 650.037 million | USD 11.485 | 56,594,487 inhabitants |
| 1987 | USD 815.836 million | USD 14.415 | 56,609,375 inhabitants |
| 1988 | USD 903,851 million | USD 15,966 | 56,649,201 inhabitants |
| 1989 | USD 939.875 million | USD 16.591 | 56.694.360 inhabitants |
| Decade of 1990 (Years 90) | |||
| 1990 | USD 1,173.063 million | USD 20,691 | 56,744,191 inhabitants |
| 1991 | USD 1,239,527 million | USD 21.844 | 56,772,923 inhabitants |
| 1992 | USD 1.314.814 million | USD 23.159 | 56,821,250 inhabitants |
| 1993 | USD 1,057,442 million | USD 18,610 | 56,842,392 inhabitants |
| 1994 | USD 1,090.596 million | USD 19.186 | 56,844,408 inhabitants |
| 1995 | USD 1,171.510 million | USD 20,609 | 56,844,197 inhabitants |
| 1996 | USD 1,309,315 million | USD 23.033 | 56,876,364 inhabitants |
| 1997 | USD 1,240,577 million | USD 21.812 | 56.904,379 inhabitants |
| 1998 | USD 1,268,032 million | USD 22,284 | 56,909,109 inhabitants |
| 1999 | USD 1,250.203 million | USD 21.968 | 56,923,524 inhabitants |
| Decade of 2000 (Years 2000) | |||
| 2000 | USD 1,145.109 million | USD 20.117 | 56,960,692 inhabitants |
| 2001 | USD 1,163,316 million | USD 20,423 | 56,987,507 inhabitants |
| 2002 | USD 1,270,994 million | USD 22.303 | 57.130,506 inhabitants |
| 2003 | USD 1,572.653 million | USD 27.527 | 57,495,900 inhabitants |
| 2004 | USD 1.800.756 million | USD 31.320 | 57,874,753 inhabitants |
| 2005 | USD 1,855,834 million | USD 32.066 | 58.064,214 inhabitants |
| 2006 | USD 1,944,939 million | USD 33.486 | 58,233,744 inhabitants |
| 2007 | USD 2.206.109 million | USD 37.890 | 58,652,875 inhabitants |
| 2008 | USD 2.402.062 million | USD 40,954 | 59,000.586 inhabitants |
| 2009 | USD 2.190.7 billion | USD 37.130 | 59.190.143 inhabitants |
| Decade of 2010 (Years 10) | |||
| 2010 | USD 2.129.021 million | USD 35.969 | 59,364,690 inhabitants |
| 2011 | USD 2.278.376 million | USD 38.379 | 59,394,207 inhabitants |
| 2012 | USD 2.073.971 million | USD 34.919 | 59,685,227 inhabitants |
| 2013 | USD 2.131.157 million | USD 35.707 | 60,782,668 inhabitants |
| 2014 | USD 2.155.153 million | USD 35,457 | 60,795,612 inhabitants |
| 2015 | USD 1.825.820 million | USD 30.032 | 60,665,551 inhabitants |
| 2016 | USD 1,850.735 million | USD 30.507 | 60.667,000 inhabitants |
| 2017 | USD 1,807,425 million | USD 30.747 | 60,750,000 inhabitants |
| Source: International Monetary Fund IMF World Bank BM (2017) | |||
The GDP per capita of Italy in the early 1960s was $802. At the end of the decade (1969), Italy reached 1,808 dollars, having raised its GDP per capita by 125.4% compared to 1960.
| Year | GDP per capita in Dollar US$ |
| 1960 | 802 dollars |
| 1961 | 884 dollars |
| 1962 | 987 dollars |
| 1963 | 1.122 dollars |
| 1964 | 1.217 dollars |
| 1965 | 1.299 dollars |
| 1966 | 1.397 dollars |
| 1967 | 1.528 dollars |
| 1968 | 1.647 dollars |
| 1969 | 1,808 dollars |
1970s
The GDP per capita of Italy in the early 1970s was $2,095. At the end of the decade (1979), Italy reached 6,958 dollars, having raised its GDP per capita by 281.0% compared to 1970.
| Year | GDP per capita in Dollar US$ |
| 1970 | 2.095 dollars |
| 1971 | 2.293 dollars |
| 1972 | 2.653 dollars |
| 1973 | 3.184 dollars |
| 1974 | 3,597 dollars |
| 1975 | 4.083 dollars |
| 1976 | 4.010 dollars |
| 1977 | 4.580 dollars |
| 1978 | 5,583 dollars |
| 1979 | $6,958 |
1980s
The GDP per capita of Italy in the early 80s was $8,576. At the end of the decade (1989), Italy reached 16,591 dollars, having raised its GDP per capita by 133.4% compared to 1980.
| Year | GDP per capita in Dollar US$ |
| 1980 | 8,576 dollars |
| 1981 | 7.765 dollars |
| 1982 | 7.668 dollars |
| 1983 | 7.951 dollars |
| 1984 | 7.855 dollars |
| 1985 | 8.111 dollars |
| 1986 | 11.485 dollars |
| 1987 | 14.415 dollars |
| 1988 | 15,966 dollars |
| 1989 | 16,591 dollars |
1990s
The GDP per capita of Italy in the early 90s was $20,691. At the end of the decade (1999), Italy reached 21,968 dollars, having raised its GDP per capita by 43.23% compared to 1990.
| Year | GDP per capita in Dollar US$ |
| 1990 | 20,691 dollars |
| 1991 | 21.844 dollars |
| 1992 | 23.159 dollars |
| 1993 | 18,610 dollars |
| 1994 | 19.186 dollars |
| 1995 | 20,609 dollars |
| 1996 | 23.033 dollars |
| 1997 | 21.812 dollars |
| 1998 | 22,284 dollars |
| 1999 | 21.968 dollars |
2000s
The GDP per capita of Italy in the early 2000s was $20,117. At the end of the decade (2009), Italy reached 37,130 dollars, having raised its GDP per capita by 143.0% compared to the year 2000.
| Year | GDP per capita in Dollar US$ | GDP per capita in Euro €$ |
| 2000 | 20.117 dollars | 21.800 Euros |
| 2001 | 20,423 dollars | 22.800 Euros |
| 2002 | 22.303 dollars | 23.600 Euros |
| 2003 | 27,527 dollars | 24.200 Euros |
| 2004 | 31,320 dollars | 25,000 Euros |
| 2005 | 32.066 dollars | 25.600 Euros |
| 2006 | 33,486 dollars | 26.500 Euros |
| 2007 | 37,890 dollars | 27.400 Euros |
| 2008 | 40,954 dollars | 27.600 Euros |
| 2009 | 37.130 dollars | 26.400 Euros |
2010s
The GDP per capita of Italy in the early 10s was $35,969. Until the middle of the decade (2016), Italy reached 30,507 dollars, having decreased by 51.4% its GDP per capita compared to 2010.
| Year | GDP per capita in Dollar US$ | GDP per capita in Euro €$ |
| 2010 | 35,969 dollars | 26.800 Euros |
| 2011 | 38.379 dollars | 27.300 Euros |
| 2012 | 34.919 dollars | 26.700 Euros |
| 2013 | 35,707 dollars | 26.500 Euros |
| 2014 | 35,457 dollars | 26.700 Euros |
| 2015 | 30.032 dollars | 27.100 Euros |
| 2016 | 30,507 dollars | 27.600 Euros |
| 2017 | 30,747 dollars | 28,000 Euros |
| 2018 | ||
| 2019 |
Economic data of the population
Employed population 30.3 million approximately in 2016.
Employed population by sector
- Agriculture: 1.99%
- Industry: 20,06%
- Services: 77.95%
Foreign trade
Imports
The merchandise with the greatest weight in Italy's imports for the period 2010-until July 2015 is presented below. The figures are expressed in US dollars, FOB value.

| Date Mercy per tariff chapter | 2010 | 2011 | 2012 | 2013 | 2014 | January-July 2015 |
|---|---|---|---|---|---|---|
| 27 - mineral fuels, mineral oils and distillation products; bituminous matter; mineral waxes | 88.935.523.539 | 111.564.759.163 | 108.003.742.845 | 93.558.266.182 | 75.129.562.196 | 38.085.313.514 |
| 84 - boilers, machines, appliances and mechanical devices; parts of these machines or appliances | 39.733.210.310 | 42.602.789.320 | 37.787.769.358 | 38.922.934.234 | 42.255.477.116 | 13.556.489.059 |
| 87 - motor vehicles, tractors, speedboats and other ground vehicles, parts and accessories | 41.450.460.799 | 43.094.629.723 | 31.891.186.487 | 32.432.045.906 | 35.807.897.352 | 12.808.450.917 |
| 85 - electrical equipment, equipment and parts thereof | 44.742.452.087 | 43.664.352.890 | 33.932.708.780 | 31.675.862.908 | 31.716.237.750 | 10.936.418.571 |
| 30 - packed drugs | 18.446.698.226 | 21.062.682.110 | 20.372.511.600 | 20.863.428.498 | 21.333.337.870 | 6.806.630.528 |
| 39 - plastics and their derivatives | 18.501.107.774 | 21.384.401.032 | 18.850.784.856 | 19.915.666.890 | 20.522.533.910 | 6.176.447.053 |
| 72 - cast iron and steel | 19.060.163.757 | 24.323.849.870 | 18.325.870.744 | 18.234.586.285 | 18.950.247.848 | 6.107.345.500 |
| 29 - Organic chemicals | 14.802.376.160 | 17.257.068.005 | 16.907.766.549 | 18.171.674.492 | 16.358.888.143 | 5.155.059.596 |
| 90 - instruments and apparatus of optics, photography or cinematography, measuring, control or precision; instruments and medical apparatuses; parts and accessories of these instruments or apparatuses | 11.050.594.700 | 11.742.290.352 | 10.702.610.982 | 11.195.981.861 | 12.030.212.589 | 3.971.112.283 |
| 71 - natural or cultivated pearls, precious or semi-precious stones, precious metals, precious metal plates and manufactures of these materials; jewellery; coins | 9.168.386.015 | 12.077.750.049 | 12.886.822.557 | 10.578.921.225 | 10.367.435.190 | 4.228.637.926 |
| More chapters | 167.870.751.611 | 191.671.544.882 | 168.657.231.283 | 172.678.677.745 | 179.081.061.121 | 54.926.531.079 |
| Total | 473.761.724.980 | 540.446.117.397 | 478.319.006.042 | 468.228.046.225 | 463.552.891.085 | 142.758.436.026 |
Exports
The following are Italy's main trading partners for the period 2010-July 2015. Most of its importers are in Europe except for the United States, China, Russia and Turkey. The figures expressed are in US dollars.

| Date Importing country | 2010 | 2011 | 2012 | 2013 | 2014 | January-July 2015 |
|---|---|---|---|---|---|---|
| Germany | 57.168.976.131 | 66.657.964.316 | 61.755.522.798 | 63.414.361.699 | 65.693.743.655 | 18.724.080.365 |
France | 50.949.386.341 | 58.568.844.370 | 54.588.081.872 | 55.150.510.768 | 54.880.772.099 | 15.604.964.182 |
United States | 26.850.346.402 | 31.090.697.163 | 34.146.560.171 | 35.771.494.421 | 39.441.529.367 | 13.294.959.244 |
Switzerland | 21.234.549.603 | 28.315.138.568 | 29.431.295.751 | 27.101.041.294 | 25.305.469.179 | 7.172.943.323 |
United Kingdom | 23.544.109.986 | 23.935.459.846 | 23.875.539.862 | 25.525.319.786 | 27.212.492.220 | 7.743.407.954 |
Spain | 25.472.097.302 | 26.685.932.579 | 23.108.191.201 | 22.348.634.209 | 23.434.204.905 | 6.983.577.497 |
Belgium | 11.192.066.704 | 12.995.100.116 | 12.937.608.774 | 14.784.626.219 | 17.163.372.775 | 4.878.383.107 |
China | 11.384.727.648 | 13.594.319.341 | 11.535.893.839 | 13.048.225.321 | 13.900.059.989 | 3.704.856.981 |
Turkey | 10.498.140.771 | 12.990.123.827 | 13.442.196.259 | 13.268.948.163 | 12.746.956.041 | 3.538.665.970 |
Russia | 10.478.799.594 | 12.715.472.491 | 12.824.807.346 | 14.322.484.275 | 12.702.775.009 | 2.415.406.270 |
| Rest of the world | 189.337.057.900 | 215.422.247.851 | 212.152.827.285 | 221.700.386.175 | 225.004.271.245 | 62.701.313.640 |
| Total | 438.110.258.383 | 502.971.300.467 | 489.798.525.160 | 506.436.032.330 | 517.485.646.482 | 146.762.558.533 |
Contenido relacionado
Sangha-Mbaéré Economic Prefecture
Pethorca Province
Curicó