Economy of Brazil
The Brazilian economy is the largest economy in Latin America in terms of GDP and the second in all of the Americas, the twelfth worldwide according to the IMF, the CIA The World Factbook, and the World Bank. With a GDP (Gross Domestic Product) in purchasing power parity (PPP) value of 3,248,000 million dollars as of 2019. According to estimates by the IMF, the South Bank and the World Bank, the Brazilian economy in the following decades, it must be among the five largest powers in the world, along with China, the United States, India and Indonesia. Considering the estimated population for the year 2019 (211 million people), the per capita income would amount to US$15,600 dollars. Brazilian exports reach, as of 2019, USD 217 billion.
The Brazilian economy has become one of the main ones in the world, since 2003, fostered by an increase in the volume and price of international demand for raw materials, basically minerals, oil, coal, and meat that was accompanied by the entry of new capital and a set of structural reforms. In this way, it was possible to achieve greater macroeconomic stability and a reduction in poverty levels, with an expansion of social assistance programs for the poor.
Brazil faced the economic crisis that began in 2008 with greater room for maneuver than on previous occasions. The drop in GDP in 2009 was only 0.3% and in 2010 it rose sharply, reaching 7.5%.
However, since 2011, there has been an exhaustion of the growth model experienced up to that moment and the existence of some structural limitations to growth, which has not yet taken off, despite the fact that it has significant natural resources, a relatively young population and political and economic stability.
Its economy was relatively closed, it has about US$349 billion in international reserves. In 2009: The volume of retail sales in Brazil recorded a seasonally adjusted increase of 1.5 in February, thus extending the slight upturn in January, reported the Brazilian Institute of Geography and Statistics (IBGE). Retail sales grew by 3.8% year-on-year in February.
In 2016, Brazil is the third most unequal country in Latin America. In 2016, the richest 10% of the population owns 55% of the national income.
Sectors of the economy
The primary sector (agriculture and livestock) is responsible for around 5% of Brazil's total GDP in 2019, since IBGE considers only what is produced on farms. In 2019, the sector moved R $ 322 billion out of a total of R $ 7.3 trillion. If the participation of agro-industries (such as slaughterhouses) and the service sector of the activity (such as freight transport) is taken into account, agribusiness as a whole represents at least 20% of Brazilian GDP.
Brazil is the world's largest producer of sugar cane, soybeans, coffee, oranges, guarana, açaí and Brazil nuts; It is one of the 5 largest producers of corn, papaya, tobacco, pineapple, banana, cotton, beans, coconut, watermelon, and lemon; and is one of the world's 10 largest producers of cocoa, cashew, avocado, persimmon, mango, guava, rice, sorghum, and tomato. It is also among the world's 15 largest producers of grapes, apples, melons, peanuts, figs, peach, onion, natural rubber and palm oil.
In 2019, Brazil was the world's largest producer of sugarcane, soybeans, coffee and orange, the 2nd largest producer of papaya, the 3rd largest producer of corn, tobacco· and pineapple, the 4th producer of cotton and cassava, the fifth producer of coconut and lemon, the sixth producer of cocoa and avocado, ninth producer of rice, 10th producer of tomato and eleventh largest producer of grapes and apples ·. Finally, Brazil also produces large amounts of beans·, peanuts, potatoes·, carrots, cashews, mandarins, persimmons, strawberries, guarana, guava, açaí, Brazil nut·, yerba mate, among others. Sugarcane is used for the manufacture of sugar but also for ethanol that is intended to operate a fleet of vehicles (the ethanol sector is a biofuel).
In the production of animal proteins, Brazil is today one of the largest countries in the world. In 2019, the country was the world's largest exporter of chicken meat. It was also the second-largest producer of beef, the world's third-largest producer of milk, the world's fourth-largest producer of pork, and the seventh-largest producer. egg producer in the world.
In 2017, the flocks in Brazil were of the following order: 1,425,699,944 birds, with 242,767,457 chicks and 15,473,981 quails; 214,899,796 cattle, 41,099,460 pigs, 17,976,367 sheep, 9,592,079 goats and 1,381,395 buffaloes, in addition to 5,501,872 horses.
In the mining sector, Brazil stands out in the extraction of iron ore (where it is the second world exporter), copper, gold, bauxite (one of the 5 largest producers in the world), manganese (one of the 5 largest producers in the world), tin (one of the largest producers in the world), niobium (concentrates 98% of the world's known niobium reserves) and nickel. Regarding precious stones, Brazil is the world's largest producer of amethyst, topaz, agate and one of the main producers of tourmaline, emerald, aquamarine, garnet and opal.
In 2019, the figures for Brazil were as follows: it was the world's largest producer of niobium (88.9 thousand tons); the second world producer of tantalum (430 tons); the second world producer of iron ore (405 million tons); the fourth world producer of manganese (1.74 million tons); the fourth world producer of bauxite (34 million tons); the fourth world producer of vanadium (5.94 thousand tons).); the fifth world producer of lithium (2.4 thousand tons); the sixth world producer of tin (14 thousand tons); the eighth world producer of nickel (60.6 thousand tons); the eighth world producer of phosphate (4.7 million tons); the twelfth world producer of gold (90 tons); the fourteenth world producer of copper (360 thousand tons); the fourteenth world producer of titanium (25 thousand tons); the world's thirteenth producer of gypsum (3 million tons); the world's third producer of graphite Ito (96 thousand tons); the twenty-first world producer of sulfur (500 thousand tons); the ninth world producer of salt (7.4 million tons); in addition to having had a chrome production of 200 thousand tons.
In the secondary sector (industry), Brazil is the industrial leader in Latin America. In 2019, the secondary sector, which includes plastics, food, beverages, metallurgy, the textile industry, among others, represented only 11% of economic activity in Brazil. Two decades ago, the activity represented more than 15% of GDP. In 1970, participation was 21.4%. The Brazilian industry is one of those that showed the largest decline in the world in almost 50 years. The deindustrialization of the Brazilian economy is very particular and it happened very early, since it is normal for the industry to lose space when the per capita income of families begins to grow, since they consume more services and fewer goods, however, in Brazil, A high per capita income was not achieved and the country did not become rich enough for the productive structure to migrate so quickly. With that, the country is stagnant. The stagnation of the sector partly explains the slow resumption of the labor market in the country. The solution to the problem, according to experts, would be more financing mechanisms, solving bottlenecks in the national infrastructure and in the tax system to leverage the industry again and make Brazil more competitive. Brazil is the ninth industrial park in the world.
In the food industry, in 2019, Brazil was the second largest exporter of processed foods in the world. In 2016, the country was the second largest producer of pulp in the world and the eighth largest producer of paper. In the footwear industry, in 2019, Brazil ranked fourth among world producers. In 2019, the country was the eighth producer of vehicles and the ninth producer of steel in the world. In 2018, Brazil's chemical industry was the 8th in the world. In the textile industry, Brazil, although it was among the 5 largest world producers in 2013, is very poorly integrated into world trade. In the aviation industry, Brazil has Embraer, the third largest aircraft manufacturer in the world, behind only Boeing and Airbus.
The tertiary sector (commerce and services) represented 75.8% of the country's GDP in 2018, according to the IBGE. The services sector was responsible for 60% of GDP and trade was responsible for 13%. It covers a wide range of activities: trade, accommodation and food, transport, communications, financial services, real estate activities and services provided to companies, public administration (urban cleaning, sewerage, etc.) and other services such as education, social and health services., research and development, sports activities, etc., since it is made up of complementary activities to other sectors.
Micro and small businesses account for 30% of the country's GDP. In the commercial sector, for example, they represent 53% of GDP within the activities of the sector.
In 2017, the number of people employed in commercial activities in Brazil was 10.2 million people (74.3% in retail trade, 17.0% in wholesale trade and 8.7% in vehicle trade, parts and motorcycles). The number of trading companies was 1.5 million and the number of stores was 1.7 million. Business activity in the country generated R$3.4 billion in net operating income (gross income less deductions, such as write-offs, discounts, and taxes) and R$583.7 billion in gross value added. The commercial margin (defined by the difference between net resale income and the cost of goods sold) reached R $ 765.1 billion in 2017. Of this total, retail trade was responsible for 56.4%, wholesale 36.0% and trade in vehicles, spare parts and motorcycles at 7.6%. In 2017 net operating income, retail trade had 45.5%, wholesale 44.6% and the automotive sector 9.9%. Among the groups of commercial activities, Hypermarkets and Supermarkets had 12.5%; the wholesale trade of fuels and lubricants had 11.3%; retail and wholesale trade of food products, beverages and tobacco had 4.8% and 8.4%, respectively; motor vehicle trade, 6.1%; the wholesale trade of machines, devices and equipment, including information and communication technologies, had 3.7%.
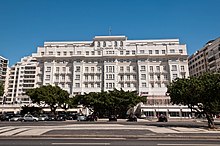
Revenues from tourism in the country in 2019 totaled R $ 238.6 billion. The Southeast represented 61.6% of the income of the tourism sector, with R $ 147 billion, of which R $ 96.7 billion only in São Paulo. Rio de Janeiro, second in sales, obtained R $ 25.5 billion. Minas Gerais presented R $ 19.2 billion in sales. The South participated with 15.9% (R$37.9 billion) while the Northeast was responsible for 12.6% (R$30 billion). Midwest (6.9%, R$16.5 billion) and North (3.0%, R$7.3 billion) complete the picture. The restaurant and related segments (53.3%), passenger transport (26%) and lodging and related (11%) were responsible for 90% of tourism sales, with a value of around R$216 billion. Today, there are 2.9 million workers in the sector, 67% of whom work in room and board.
Exports
Brazil was the 27th largest exporter in the world in 2019, with 1.2% of the world total.
In 2019, Brazil exported almost $225 billion and imported $177 billion, with a surplus of $48 billion. The ten main export products of the country were:
- Soja: it represented 12% of the country's exports, with a value of $26 billion.
- Oil - 11% of exports, for a value close to $24 billion.
- Iron ore: almost 10% of Brazil's exports, worth $22 billion.
- Cellulose: 3.4% of exports, valued at $7.5 billion.
- Maize - 3.3% of national exports, valued at $7.3 billion.
- Reef: almost 3% of Brazilian exports, totaling $6.5 billion.
- Chicken meat: 2.8% of the country's exports, worth $6.3 billion.
- Soy flour: 2.6% of Brazilian exports, valued at $5.8 billion.
- Sugar: 2% of exports, valued at $4.6 billion.
- Coffee - 2% of exports, worth $ 4.5 billion.
In manufacturing in general, the country exported US$5.8 billion during the year. The country also exports cotton, tobacco, orange juice, shoes, planes, helicopters, cars, vehicle parts, gold, ethanol, semi-finished iron, among others.
The main countries to which Brazil exports in 2019 were:
- China - $63.4 billion
- United States - $29.7 billion
- Netherlands - $10.1 billion
- Argentina - $9.8 billion
- Japan - $5.4 billion
- Chile - $5.2 billion
- Mexico - $4.9 billion
- Germany - $4.7 billion
- Spain - $4 billion
- South Korea - $3.4 billion.
The country's export model, to this day, is excessively based on exports of basic or semi-manufactured products, generating criticism, since said model generates little monetary value, which prevents greater growth in the country in the long term. There are several factors that cause this problem, the main ones being: the excessive collection of taxes on production (due to the fact that the economic and legislative model of the country is based on State Capitalism and not on free market capitalism), the lack of or deficiency of infrastructure (means of transport such as roads, railways and ports that are insufficient or weak for the needs of the country, poor logistics and excessive bureaucracy) for export, high production costs (expensive energy, expensive fuel, maintenance of expensive trucks, loan rates and bank financing for expensive production, expensive export taxes), low efficiency of the Brazilian labor force, lack of an industrial policy, lack of focus on value added, lack of aggressiveness in international negotiations, in addition to the abusive tariff barriers imposed by other countries on the country's exports. Because of this, Brazil has never been very prominent in international trade. Due to its size and potential, it could be among the 10 largest exporters in the world, however, its participation in global trade transactions usually ranges between 0.5 and 2% only. Among the ten products that Brazil exports the most and that generate the most value, eight come from agribusiness. Although still modest, the country's exports have evolved and today are more diversified than in the past. At the beginning of the XX century, 70% of Brazilian exports were restricted to coffee. In general, however, world trade still concentrates its few exports in low-technology products (mainly agricultural and mineral products) and, therefore, with low added value.
BRIC (Emerging Superpowers)
Brazil due to its huge population (more than 205 million inhabitants), the continuous decline in poverty, the disproportionate increase in foreign investment and rapid industrialization has become, along with China, India, Russia and Mexico, in a destination for investments at a planetary level. Brazil approached positions with the BRIC countries to improve relations between these superpowers since, as a whole, this group has more money than any commercial alliance (with the exception of the North American Free Trade Agreement).
- Year 2006:
- Main imported consumer products
- Main countries of origin of consumer imports
- Main products exported in a definitive manner
- Major destinations of final exports
- Year 2007:
- Main imported consumer products
- Main countries of origin of consumer imports
- Main products exported in a definitive manner
- Major destinations of final exports
- Year 2008:
- Main imported consumer products
- Main countries of origin of consumer imports
- Main products exported in a definitive manner
- Major destinations of final exports
- Year 2009:
- Main imported consumer products
- Main countries of origin of consumer imports
- Main products exported in a definitive manner
- Major destinations of final exports
- Year 2010:
- Main imported consumer products
- Main countries of origin of consumer imports
- Main products exported in a definitive manner
- Major destinations of final exports
- Year 2011 (updated to the first four months):
- Main imported consumer products
- Main countries of origin of consumer imports
- Main products exported in a definitive manner
- Major destinations of final exports
The first product that moved the Brazilian economy was sugar. during the colonial period. Then a new cycle began with coffee. That moment was crucial to transform the State of São Paulo into the richest in the country.
Its economy is important in the American and world arena:
- Agriculture: is the world's largest coffee producer
- Livestock: has the first bovine cabin worldwide
- Mining: with great production of precious stones
- Industry: producer of raw materials and manufactured products, including military equipment, televisions, cell phones, computers, cars and airplanes.
- Armament: Currently there is a period of renewal of its air and sea flotilla to defend the pre-sal area of oil
Foreign trade
The Brazilian economy is, in terms of nominal GDP, the first in Latin America and the third in all of America. GDP measured in nominal value occupies the 11th position worldwide (2021). But if this is measured in purchasing power parity , Brazil becomes the 9th largest economy on the planet (2021 data). Brazil's largest partners are Argentina, Mercosur, the United States, China and the European Union.
Based on the information provided by the Ministry of Industry and Foreign Trade, import and export statistics are provided by NCM product and country of origin/destination
Imports
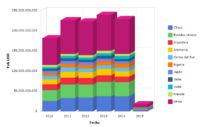
The figures presented in the table below are in US dollars FOB value and are made up of the trading partners with the greatest weight in the trade balance.
| Date Exporting country | 2010 | 2011 | 2012 | 2013 | 2014 | January-July 2015 |
|---|---|---|---|---|---|---|
| China | 25.593.139.490 | 32.788.424.507 | 34.248.498.759 | 37.302.150.042 | 37.340.607.027 | 19.974.316.638 |
| United States | 27.039.272.624 | 33.962.382.474 | 32.357.093.764 | 36.002.000.069 | 34.999.168.114 | 16.527.549.045 |
| Argentina | 14.426.306.175 | 16.906.099.483 | 16.444.100.381 | 16.462.929.322 | 14.143.094.058 | 6.449.758.245 |
| Germany | 12.552.497.479 | 15.212.859.089 | 14.208.929.793 | 15.182.002.770 | 13.837.218.760 | 6.439.309.537 |
| South Korea | 8.422.315.466 | 10.096.972.279 | 9.097.657.556 | 9.491.255.833 | 8.526.182.634 | 3.622.643.551 |
| Nigeria | 5.919.699.799 | 8.386.358.700 | 8.012.213.606 | 9.647.535.388 | 9.495.353.411 | 2.313.737.921 |
| Japan | 6.981.801.509 | 7.871.808.824 | 7.734.742.074 | 7.081.664.858 | 590.046.194 | 3.096.129.299 |
| Italy | 4.837.617.402 | 6.222.456.796 | 6.199.258.024 | 6.716.928.480 | 6.309.816.035 | 2.970.634.344 |
| India | 4.242.372.653 | 6.080.997.228 | 5.042.842.814 | 6.357.300.153 | 6.635.259.191 | 2.819.123.697 |
| France | 4.799.743.306 | 5.461.571.578 | 5.909.561.571 | 6.497.922.565 | 5.698.165.914 | 2.666.609.791 |
| Rest of the world | 66.833.909.701 | 83.253.477.949 | 83.894.231.976 | 88.879.215.425 | 86.173.146.806 | 41.374.425.331 |
| Total | 181.648.675.604 | 226.243.408.907 | 223.149.130.318 | 239.620.904.905 | 229.060.058.144 | 108.254.237.399 |
The main exporting countries to Brazil were China, the United States and Argentina. It should be noted that Argentina is the only Mercosur country that appears among the ten main exporters to Brazil.
Exports
The figures presented in the table below are in US dollars FOB value and are made up of the trading partners with the greatest weight in the trade balance.
| Date Country importer | 2010 | 2011 | 2012 | 2013 | 2014 | January-July 2015 |
|---|---|---|---|---|---|---|
| China | 30.773.029.055 | 44.288.155.177 | 41.193.215.806 | 45.991.503.598 | 40.588.365.601 | 22.564.081.991 |
States | 19.241.846.409 | 25.722.620.803 | 26.581.977.099 | 24.358.720.193 | 26.685.551.947 | 13.973.039.650 |
Argentina | 18.516.173.894 | 22.699.067.777 | 17.985.158.843 | 19.597.182.695 | 14.261.238.553 | 7.680.669.805 |
Netherlands | 10.226.401.822 | 13.638.383.566 | 15.037.847.193 | 17.321.288.448 | 13.032.420.932 | 5.945.602.694 |
Japan | 7.138.913.406 | 9.471.789.282 | 7.953.030.679 | 7.962.205.210 | 6.716.772.914 | 2.630.018.493 |
Germany | 8.132.680.368 | 9.032.398.275 | 7.267.546.567 | 6.537.276.321 | 6.623.111.662 | 3.254.817.930 |
Chile | 4.256.667.040 | 5.415.942.718 | 4.599.960.856 | 4.479.300.003 | 4.972.170.215 | 2.331.624.177 |
Venezuela | 3.849.146.797 | 4.588.151.636 | 5.052.765.243 | 4.847.056.898 | 4.630.320.532 | 1.756.482.651 |
Italy | 4.230.602.994 | 5.438.094.754 | 4.568.332.165 | 4.042.781.612 | 3.967.699.458 | 1.863.353.181 |
United Kingdom | 4.622.527.301 | 5.188.357.669 | 4.446.432.363 | 4.027.049.725 | 3.783.624.725 | 1.764.053.798 |
| Rest of the world | 87.152.676.800 | 105.496.479.145 | 102.689.852.081 | 98.185.430.726 | 95.045.279.964 | 47.168.816.191 |
| Total | 198.140.665.886 | 250.979.440.802 | 237.376.118.895 | 237.349.795.429 | 220.306.556.503 | 110.932.560.561 |
Balance of trade balance
Although in most of the period analyzed there was a surplus balance, there was a deficit in the trade balance in the two-year period 2013-2014.
| Period | Balance | Value billions |
|---|---|---|
| 2010 | surplus | 16.5 |
| 2011 | surplus | 24.8 |
| 2012 | surplus | 14,3 |
| 2013 | deficit | 2.3 |
| 2014 | deficit | 8.8 |
| ene-jul 2015 | surplus | 2.6 |
| Source |
Energy
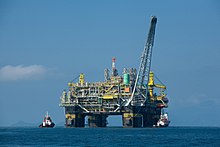
The Brazilian government has embarked on an ambitious program to reduce dependence on imported oil, over the decades. Imports previously accounted for more than 70% of the country's oil needs, but Brazil became self-sufficient in oil in 2006–2007. Brazil was the 10th largest oil producer in the world in 2019, at 2.8 million barrels/day. Production manages to supply the country's demand. At the beginning of 2020, in the production of oil and natural gas, the country exceeded 4 million barrels of oil equivalent per day for the first time. In January of this year, 3,168 million barrels of oil per day and 138,753 million cubic meters of natural gas were extracted. In 2019, Rio de Janeiro was the largest producer of oil and natural gas in Brazil, with 71% of the total volume produced. São Paulo ranks second, with a share of 11.5% in total production.
Brazil is one of the world's leading producers of hydroelectric power. In 2019, Brazil had 217 hydroelectric plants in operation, with an installed capacity of 98,581 MW, 60.16% of the country's power generation. In total electricity generation, in 2019 Brazil reached 170,000 megawatts of installed capacity, more than 75% from renewable sources (mostly hydroelectric).
In 2013, the Southeast Region used close to 50% of the load of the National Integrated System (SIN), being the main energy consuming region of the country. The region's installed electricity generation capacity totaled almost 42,500 MW, which represented about a third of Brazil's generation capacity. Hydroelectric generation represented 58% of the region's installed capacity, with the remaining 42% basically corresponding to thermoelectric generation. São Paulo represented 40% of this capacity; Minas Gerais in approximately 25%; Rio de Janeiro at 13.3%; and Espírito Santo accounted for the rest. The Southern Region owns the Itaipu Dam, which was the largest hydroelectric plant in the world for several years, until the inauguration of the Three Gorges Dam in China. It remains the second largest operating hydroelectric power plant in the world. Brazil is co-owner of the Itaipu Plant with Paraguay: the dam is located on the Paraná River, located on the border between countries. It has an installed generation capacity of 14 GW for 20 generating units of 700 MW each. The Northern Region has large hydroelectric plants, such as the Belo Monte Dam and the Tucuruí Dam, which produce a large part of the national energy. Brazil's hydroelectric potential has not yet been fully exploited, so the country still has the capacity to build several renewable energy plants on its territory.
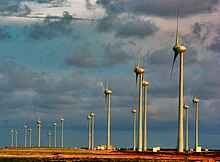
The gross potential of wind resources in Brazil was estimated, in 2019, at about 522 GW (this, only on land), enough energy to satisfy three times the current demand of the country. As of July 2022, according to ONS, the total installed capacity was 22 GW, with an average capacity factor of 58%. Although the world average wind production capacity factor is 24.7%, there are areas where northern Brazil, especially in the state of Bahia, where some wind farms register an average capacity factor of more than 60%; the average capacity factor in the Northeast Region is 45% on the coast and 49% in the interior. In 2019, wind energy represented 9% of the energy generated in the country. In 2020 Brazil was the eighth country in the world in terms of installed wind power (17.2 GW).
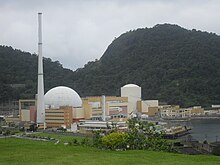
Nuclear power accounts for about 4% of Brazil's electricity. The nuclear power generation monopoly is owned by Eletronuclear (Eletrobrás Termonuclear S/A), a wholly owned subsidiary of Eletrobrás. Nuclear power is produced by two reactors in Angra. It is located at the Almirante Álvaro Alberto Nuclear Power Plant (CNAAA) at Praia de Itaorna in Angra dos Reis, Rio de Janeiro. It consists of two pressurized water reactors, Angra I, with a capacity of 657 MW, connected to the electricity grid in 1982, and Angra II, with a capacity of 1,350 MW, connected in 2000. A third reactor, Angra III, with a projected output of 1,350 MW, is scheduled for completion in 2014 and work has been halted due to environmental concerns, but licenses are being approved and heavy construction work will begin in 2009. In 2025 Brazil plans to build seven more reactors.
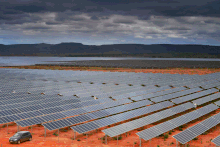
As of August 2022, according to ONS, the total installed capacity of photovoltaic solar energy was 17 GW, with an average capacity factor of 23%. Some of the most irradiated Brazilian States are MG (" Minas Gerais"), BA ("Bahía") and GO (Goiás), which in fact hold world records for irradiation levels. In 2019, solar energy represented 1.27% of the energy generated in the country. In 2020, Brazil was the fourteenth country in the world in terms of installed solar energy (7.8 GW).
In 2020, Brazil was also the second largest country in the world in energy production through biomass (energy production from solid biofuels and renewable waste), with 15.2 GW installed.
Transportation
Transportation in Brazil is basically carried out by road, the most developed in the region. There is also a considerable infrastructure of ports and airports. The rail and fluvial sector, although it has potential, is usually treated secondarily.
Brazil has more than 1.7 million km of highways, of which 215,000 km are paved, and some 14,000 km are divided highways. The two most important highways in the country are BR-101 and BR-116.
Due to the Andes Mountains, Amazon River and Amazon Rainforest, there have always been difficulties to implement transcontinental or bioceanic highways. Practically the only route that existed was the one that connected Brazil with Buenos Aires, in Argentina, and then with Santiago, in Chile. However, in recent years, with the joint efforts of the countries, new routes have begun to emerge, such as Brazil-Peru (Interoceanic Highway), and a new highway between Brazil, Paraguay, northern Argentina, and northern Chile (Corredor bioceanic).
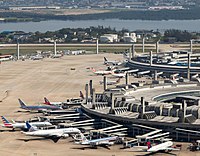
There are more than 2,000 airports in Brazil. The country has the second largest number of airports in the world, behind only the United States. São Paulo International Airport, located in the São Paulo Metropolitan Region, is the largest and busiest in the country - the airport connects São Paulo with virtually all major cities in the world. Brazil has 44 international airports, such as those in Rio de Janeiro, Brasilia, Belo Horizonte, Porto Alegre, Florianópolis, Cuiabá, Salvador, Recife, Fortaleza, Belém and Manaus, among others. The 10 busiest airports in South America in 2017 were: São Paulo-Guarulhos (Brazil), Bogotá (Colombia), São Paulo-Congonhas (Brazil), Santiago (Chile), Lima (Peru), Brasilia (Brazil), Rio de Janeiro. (Brazil), Buenos Aires-Aeroparque (Argentina), Buenos Aires-Ezeiza (Argentina) and Minas Gerais (Brazil).
About ports, Brazil has some of the busiest ports in South America, such as Port of Santos, Port of Rio de Janeiro, Port of Paranaguá, Port of Itajaí, Port of Rio Grande, Port of São Francisco do Sul, Port of Manaus and Port of Suape. The 15 busiest ports in South America are: Port of Santos (Brazil), Port of Bahía de Cartagena (Colombia), Callao (Peru), Guayaquil (Ecuador), Buenos Aires (Argentina), San Antonio (Chile), Buenaventura (Colombia), Itajaí (Brazil), Valparaíso (Chile), Montevideo (Uruguay), Paranaguá (Brazil), Rio Grande (Brazil), São Francisco do Sul (Brazil), Manaus (Brazil) and Coronel (Chile).
The Brazilian railway network has an extension of about 30,000 kilometers. It is basically used to transport minerals.
Among the main Brazilian waterways, two stand out: Paraná-Tieté Waterway (which has a length of 2,400 km, 1,600 on the Paraná River and 800 km on the Tietê River, draining agricultural production from the states of Mato Grosso, Mato Grosso do Sul, Goiás and part of Rondônia, Tocantins and Minas Gerais) and Hidrovia do Solimões-Amazonas (it has two sections: Solimões, which extends from Tabatinga to Manaus, with approximately 1600 km, and Amazonas, which extends from Manaus to Belém, with 1650 km Almost all passenger transport from the Amazon plain is carried out by this waterway, in addition to practically all cargo transport that goes to the main regional centers of Belém and Manaus). In Brazil, this transport is still underused: the most important sections of waterways, from an economic point of view, are located in the southeast and south of the country. Its full use still depends on the construction of locks, large dredging works and, mainly, ports that allow intermodal integration.
Tourism
In the list of world tourist destinations, in 2018, Brazil was the 48th most visited country, with 6.6 million tourists (and income of 5.9 billion dollars). Tourism in South America as a whole is still underdeveloped: in Europe, for example, countries get annual tourism figures of $73.7 billion (Spain), receiving 82.7 million tourists or 67.3 billion dollars (France), receiving 89.4 million tourists. While Europe received 710 million tourists in 2018, Asia 347 million and North America 142.2 million, South America received only 37 million, Central America 10.8 million and the Caribbean 25.7 million.
Economic history
Main exported products (1902-1914)
The main products that Brazil exported in this period were mainly two, which accounted for 78.2% of all the products it exported. The most important of all was coffee (62.3% of total exported products) and in second place was rubber (with 15.9% of total production).
Brazil, unlike other Latin American countries, had a small range of exportable products: coffee, rubber, sugar and cotton. Coffee was the product that gave dynamism to the economy and thanks to it, the country was one of the main exporters of this product in the world market.
Main trading partners (1902-1914)
The main buyers of products that Brazil exported were the United States, England, Germany and France. All of them accounted for around 80% of the country's exports. Mainly the United States, which was the country with which it traded the most of all (it accounts for around 40% of Brazil's exports during this period) and in second place, England. Over time, the partners with whom he traded have changed very little. The main partners with whom it traded continue to be maintained.
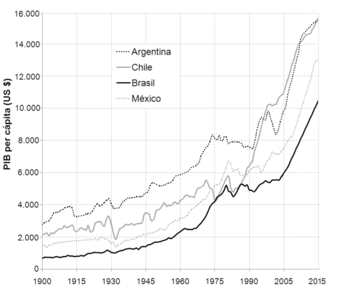
Convergence/Divergence (1910-1949)
During World War I, Brazil's GDP per capita increased due to the arrival of European labor. With respect to other countries, we can see that it diverges (that is, that it grows at a much slower rate) with the United States and Spain.
During the Great Depression, Brazil's GDP per capita fell due to the 1929 crisis, but soon recovered as it did not depend as much on the financial market. It converges with the United States and Spain, not because their economies are growing faster than the rest, but because these countries are greatly affected by this crisis and Brazil not so much.
During World War II, Brazil's GDP per capita increased. With respect to the United States, Brazil diverges because the country experiences rapid growth during this period. With respect to Spain, however, we find that it converges.
Implementation of ISI policies (1950-1970)
Brazil's exports during this period of years suffer a decline, so we can say that it really achieves its objective with the ISI, depending less on exports. Starting in 1952, Brazil experienced changes in its currency. The value of Cruceiros doubles, as a consequence, with one dollar you could get more. So other countries are encouraged when buying Brazilian products. The country stops depending on the exports it made of its main product, coffee.
For the substitution of imports, Latin American countries must make large investments in the purchase of machinery. In this way, they can make the manufactured products they need for their consumption themselves instead of having to buy them from other countries and making it much more expensive. But Brazil does not have enough money to buy machinery and intermediate goods at the same time. For this reason, there are several cycles of purchasing machinery and then intermediate goods. In addition, Brazil stops importing consumer goods from other countries to consume those produced by themselves.
Between 1952 and 1967 there was a period of public deficit in Brazil. It just coincides with the years in which the country strongly implements ISI policies.
The periods in which the deficit intensifies coincide with an increase in the purchase of capital goods, that is, the country spends more money than it has to purchase machines and coincides with the fact that its exports decrease. The period of years in which it experiences a surplus coincides with the fact that the country stops buying capital and begins to import intermediate goods and just coincides with the increase in exports.
With the ISI policies, what the governments were trying to do was for the industry to develop and thus help national production in order to reduce manufacturing imports. As we can see, the percentage of this sector increases considerably. It goes from representing 21% to 30%. As far as we can tell, Brazil did manage to grow the industrial sector and in turn make it contribute to national production.
The arrival of democracy (1970-present)
Sarney's administration could not reap significant economic successes. GDP, in real terms, was exactly the same in 1990, at the end of Sarney's term, as it was in 1982. The new president Fernando Collor de Mello eluded Congress carrying out his government plan through provisional legislative decrees of necessity and urgency. Collor de Mello issued 37 provisional measures in the first 60 days of his administration. De Mello started a large-scale privatization policy. From his first day as president, he proposed radical measures to control inflation, such as the end of price fixing, which in the long term proved ineffective, adopting the so-called "Washington Consensus", a set of recipes neoliberals that were recommended to Latin American countries to boost their economies. The bases of this consensus were the implementation of a market economy and economic opening, the reduction of its public spending and the privatization of its state companies. However, the measures of `large-scale privatization and strong cuts in public spending did not work. and inflation revived in the mid-1990s. The economy remained stagnant and the drop in GDP was the largest since the war, while 7,500,000 people had lost their jobs as a result of Collor de Mello's policies.
By 1992, GDP had fallen by 1.5% and annual inflation was close to 1200%. During Collor de Mello's administration, the country completed three consecutive years of economic stagnation. This prolonged recession implied a contraction in domestic demand and a significant rise in the unemployment rate.
Fernando Collor de Mello established a large political corruption scheme, using influence peddling, and the government lobby system in exchange for bribes, to obtain money from businessmen and public officials in exchange for political favors, using for this purpose his campaign treasurer, Paulo César Farías. The economic situation had gradually worsened as oil prices fell. The currency had been heavily devalued, inflation was very high and the external debt was a heavy burden for the country, international reserves fell to 6,555 million dollars and the global fiscal deficit at the time of the change of government represented 15.1%. of GDP.
In 1991 a corruption scandal broke out that led to the dismissal of Fernando Collor de Mello and his replacement by the vice president, Itamar Franco. Itamar continued with the policies based on the "Washington Consensus", without results. In 1992 inflation was 1,119% and a year later it would be 2,477%.
Already during the presidency of Fernando Henrique Cardoso, Brazil began to feel the effects of monetary contraction and high interest rates, which directly affected the level of activity. Unemployment increased and many companies had to close their doors due to the impossibility of being able to compete with imported products, both due to the commercial opening policies and the overvaluation of the currency. In turn, the fiscal and external deficit had to be covered through through both internal and external financing, generating a continuous increase in public debt and interest rates. The response of the monetary authorities was that the fiscal deficit would be solved by deepening the adjustments in public spending, while the external deficit would be transitory. Cardoso reached an agreement with the IMF, through which the organization offered an aid package for 40,000 million dollars in exchange for the country applying new fiscal adjustments, in December 1998, and a month later Cardoso had to announce an extension of the monetary band that allowed a devaluation of the Real of up to 8%. This measure did nothing more than justify the fears about the impossibility of maintaining the exchange rate, which is why the capital flight became even more intense and two days later the free float of the real had to be announced, which lost 60% of its value. its value in just one month and a devaluation close to 40%.
Having become the largest economy in Latin America, Brazil is among the 10 largest in the world, which is why it is classified among the emerging countries with high development potential, constituting, together with Russia, India and China, the group known as BRIC. Its powerful industrial development is reflected in the fact that 74% of exported goods are manufactured and semi-manufactured and the sector represents about 31% of GDP. In the aerospace field, Brazil has a regional presence.
The governments of Lula Da Silva and Dilma Rousseff have made efforts to reduce inequalities in income distribution and to increase per capita income. During her eight years as president of Brazil, she made reforms and radical changes that produced the social and economic transformation of Brazil, which tripled its GDP per capita according to the World Bank,
Brazil is still one of the most unequal countries in the world, but now it is a little less(1). Between 2003 and 2010, the income of the poorest 10% of the population grew by 8% per year: much faster than the economy and the income of the richest 10% of the population (+1.5%).
In 2009, the United Nations (UN) Human Rights Council explained: “The tax rate is very high for goods and services, and low for income and wealth. Families that receive an income equivalent to less than two minimum wages pay an average of 46% of their income in indirect taxes.”
In 2009, the volume of retail sales in Brazil registered a seasonally adjusted increase of 1.5 in February, thus extending the slight rise in January, reported the Brazilian Institute of Geography and Statistics (IBGE). Retail sales grew by 3.8% year-on-year in February.
Economic crisis (2014-present)
The economic crisis, the lack of public policies and corruption led to an increase in poverty in 2017. The Brazilian people, in rebellion, make massive protests in the streets, with millions of people, calling for the end of leftism in the country. In 2019, the right-wing candidate Jair Bolsonaro, an ex-military, is elected.
Brazil in the international context
Brazil's economy is based mainly on the following sectors: agriculture (world's leading producer of coffee), mining (precious stones), manufacturing (military equipment, electronics, automobiles, airplanes) and services (tourism power).
Brazil has experienced spectacular growth in recent years. It is a prominent member of the emerging countries (BRIC) and the only one from Latin America. Its Gross Domestic Product has increased by 284% in the period from 2000 to 2011. After the 2008 crisis, Brazil quickly recovered from the process of stagnation due to exports and the excellent health of the domestic market. Another fact to take into account is its per capita income offered by the World Bank, which in the same period (2000-2011) increased by 225%, reaching $12,500 in 2011.
| Indicator | Value | Position in the world | Increase |
|---|---|---|---|
| Gross Domestic Product (nominal) | $2,476,652,100,000 Source: World Bank (2011) | Richest countries in the world by GDP 6.o | 644.475.650.048 $ in 2000 (incr: 284.3 per cent) Source: Brazil tab at World Bank |
| Surface | 8.514.880 km2 Source: World Bank (2010) | The world's largest countries Post 5.o | 8.511.965 km2 in 2008 (incr: 0%) Source: Brazil tab at World Bank |
| Population | 196.655.008 persons Source: World Bank (2011) | Most populous countries in the world Post 5.o | 174.160.608 persons in 2000 (incr: 12.9%) Source: Brazil tab at World Bank |
| CO2 emissions | 1.9 tons Source: World Bank (2009) | Countries with higher CO2 emissions Post 110 | 1,857 tons in 2000 (incr: 2.3%) Source: Brazil tab at World Bank |
| Per capita income | 12,594 $ Source: World Bank (2011) | Countries with the largest Renta Per Capita Post 27 | $3,870 in 2000 (incr: 225,4%) Source: Brazil tab at World Bank |
| Birth rate | 1.8 persons Source: World Bank (2012) | Countries with highest birth (children per woman) Post 132.o | 2387 persons in 2000 (incr: -24.6%) Source: Brazil tab at World Bank |
| Economic growth | 2.7% Source: World Bank (2011) | Higher growth economies Post 113o | 4.29 % in 2000 (incr: -37.1%) Source: Brazil tab at World Bank |
| % Internet users | 45 % Source: World Bank (2011) | Countries with the highest rate of Internet users Post 74 | 2.87 % in 2000 (incr: 1467.9%) Source: Brazil tab at World Bank |
| Average days to create a company | 119 days Source: World Bank (2011) | Faster countries for a company Post 5.o | 152 days in 2003 (incr: -21.7 per cent) Source: Brazil tab at World Bank |
| Energy consumption per inhabitant | 1,295 kilograms Source: World Bank (2008) | Countries with increased energy consumption per capita Post 72 | 1,066.24 kilograms in 2000 (incr: 21.5%) Source: Brazil tab at World Bank |
| Land dedicated to agriculture | 31.3 % Source: World Bank (2009) | Countries with more land devoted to agriculture Post 123.o | 30.9 % in 2000 (incr: 1.3%) Source: Brazil tab at World Bank |
| Power consumed | 2,384 kilowatt-hour Source: World Bank (2010) | Countries with more electricity consumed Post 42 | 1,893.76 kilowatt-hour in 2000 (incr: 25.9%) Source: Brazil tab at World Bank |
| Forest area | 5.195.220 km2 Source: World Bank (2010) | Countries with greater forest area 2.o Post | 4.932.130 km2 in 2000 (incr: 5.3%) Source: Brazil tab at World Bank |
| Paved roads | 8 % Source: World Bank (2004) | Countries with more paved roads Post 166 | 5.5 % in 2000 (incr: 45.5 per cent) Source: Brazil tab at World Bank |
| Global Competitiveness Index | 4,401 Source: World Economic Forum (2013) | Most competitive countries Post 48 | 4.03 in 2007 (incr: 9.2%) Source: Brazil tab at World Economic Forum |
Contenido relacionado
Small property
Demand
Volkswagen

