
Demographics of Bosnia and Herzegovina

_10.JPG)
The demography of Bosnia and Herzegovina statistically studies the structure and dynamics of the resident population in the Bosnian-Herzegovinian territory, as well as the processes that determine it: fertility, mortality, and migration (emigration and immigration). in said territory.
According to the 1991 population census, Bosnia and Herzegovina had a population of &&&&&&&&04369319.&&&&&04,369,319 inhabitants, while the World Bank census conducted in 1996 dropped to &&&&& &&&03764425.&&&&&03,764,425 inhabitants. The large-scale migratory movements produced during the Yugoslav wars in the 1990s have caused major demographic changes in the country. Between 1991 and 2013, political disagreements made it impossible to organize a census. A census was planned to be carried out in 2011, and later in 2012, but it was not carried out until October 2013. According to the population census carried out in that year there are a total of 3,791,622 inhabitants in 1.16 million household; so there has been a reduction of 585,411 inhabitants since the 1991 census.
In Bosnia and Herzegovina there are mainly three ethnic groups, which are Bosniaks, Serbs and Croats. Minorities such as Jews and Gypsies can also be found. According to 2013 census data, Bosniaks make up 50.11% of the population, Serbs 30.78%, Croats 15.43%, while that other ethnic groups correspond to 2.73%, while the rest of the population do not respond.
The territory is divided into the Federation of Bosnia and Herzegovina and the Republika Srpska. Proportionally, the Federation occupies 51% of the territory and the Republic the remaining 49%. The area called Herzegovina is contiguous with Croatia and Montenegro, and was traditionally populated by ethnic Croats in the west and Serbs in the east.
The capital is Sarajevo, with half a million inhabitants. Other cities larger than &&&&&&&&&0100000.&&&&&0 100,000 inhabitants: Banja Luka, Tuzla, Bijeljina, Zenica, Mostar and Brčko. According to 2013 calculations, five of the country's most populous towns had more than 75,000 residents. These were: the capital Sarajevo (299,041 inhabitants), Banja Luka (243,031), Mostar, (128,448) Tuzla (100,825), Zenica (93,400) and Bijeljina (80,731).
Population
Although based solely on estimates, since after the Bosnian war (1992-1995) and the significant population displacements that occurred in its context, a reliable census has not been carried out, it is considered that the population of Bosnia and Herzegovina has not experienced, in terms of global figures, great variations with respect to the data of the last census of the Socialist Federal Republic of Yugoslavia.

Ethnic groups
According to 2013 census data, Bosnians make up a total of 50.11% of the population, Bosnian Serbs 30.78%, Bosnian Croats 15.43% and Others 2.73%, with the rest of the people surveyed without a clear answer regarding the ethnicity with which they identify. The census results were disputed by the Republika Srpska statistical office and by Bosnian Serb politicians. The dispute in the census stems from the addition of non-permanent Bosnian residents, something that is opposed in the Republika Srpska. However, the statistical office of the European Union, Eurostat, concluded in May 2016 that the census methodology used in the Bosnian statistical agency follows international recommendations.
Geographically, Bosnian Croats (mainly Catholics) are concentrated in the west of the country in Herzegovina as well as isolated in parts of central Bosnia and Posavina. Bosnian Serbs (mainly Orthodox Christians) are more dispersed, with the majority in the east and north. Finally, Bosnians predominate in central Bosnia, apart from the canton of Bihać and Gorazde. The rest of the minorities correspond mainly to Albanians and Gypsies.
The three main Bosnian groups listed above are ethnically Slavic, sharing a single language system (so-called Serbo-Croatian) realized in three standard stylistic forms and various dialects. During the last decade, the three communities have accentuated the religious factor as a symbol of identity and belonging to one of the three communities.
| Group ethnic | 1948 census | census 1953 | 1961 census | 1971 census | 1981 census | census 1991 | UNHCR 1996 | census 2013 | 1991–2013 | |||||||||
|---|---|---|---|---|---|---|---|---|---|---|---|---|---|---|---|---|---|---|
| Number | % | Number | % | Number | % | Number | % | Number | % | Number | % | Number | % | Number | % | Number | % | |
| Bosnian | 788.403 | 30.7 | 891,800 | 31.3 | 842,248 | 25.7 | 1,482,430 | 39.6 | 1,629,924 | 39.5 | 1,902,956 | 43.48 | 1,805,910 | 46.1 | 1,769,592 | 50.11 | -133,364 | +6.63pp |
| Bosnia and Herzegovina Serbs | 1,136.116 | 44.3 | 1,264,372 | 44.4 | 1,406,057 | 42.9 | 1,393,148 | 37.2 | 1,320,644 | 32.0 | 1,366,104 | 31.22 | 1.484,530 | 37.9 | 1,086,733 | 30.78 | -279,371 | -0.44pp |
| Croats of Bosnia and Herzegovina | 614,123 | 23.9 | 654,229 | 23.0 | 711.665 | 21.7 | 772,491 | 20.6 | 758,136 | 18.4 | 760.852 | 17.39 | 571,317 | 14.6 | 544.780 | 15.43 | -216,072 | -1.96pp |
| Yugoeslavos | 275,883 | 8.4 | 43.796 | 1.2 | 326.280 | 7.9 | 242,682 | 5.55 | 2.570 | 0.07 | ||||||||
| Montenegrins of Bosnia and Herzegovina | 3,094 | 0.1 | 7.336 | 0.3 | 12.828 | 0.4 | 13,021 | 0.3 | 14,114 | 0.3 | 10,071 | 0.23 | 1,883 | 0.05 | ||||
| Gypsies | 442 | 0.0 | 2,297 | 0.1 | 588 | 0.0 | 1.456 | 0.0 | 7.251 | 0.2 | 8,864 | 0.20 | 12,583 | 0.36 | ||||
| Albanos | 3,642 | 0.1 | 3,764 | 0.1 | 4.396 | 0.1 | 4.925 | 0.11 | 2.569 | 0.07 | ||||||||
| Other/not declared | 23,099 | 0.9 | 27,756 | 1.0 | 28.679 | 0.8 | 36,005 | 1 | 63.263 | 1.5 | 80.579 | 1.84 | 58,196 | 1.5 | 110.449 | 3.13 | ||
| Total | 2,565,277 | 2.847,790 | 3,277,948 | 3,746,111 | 4,124,008 | 4,377,033 | 3,919,953 | 3,531,159 | ||||||||||

Ethnic structure in 1895
Ethnic structure of Bosnia and Herzegovina by municipalities in 2013

Ethnic structure of Bosnia and Herzegovina by municipalities in 2013

Percentage of Bosnians of Bosnia and Herzegovina by municipalities in 2013

Percentage of Bosnia and Herzegovina Serbs by municipalities in 2013

Percentage of Croats of Bosnia and Herzegovina by municipalities in 2013


Religion
According to the 2013 census, 50.7% of the population identifies as Muslim, 30.75% as Orthodox Christians of the Serbian Orthodox Church, 15.19% as Catholic, 1.15% as Other, and 1.1% as Atheist or Agnostic, with the rest of the people surveyed without a clear answer. A 2012 survey found that 47% of Bosnian Muslims do not have a clear denomination, while 45% describe themselves as Sunni. In Bosnia and Herzegovina, religion is closely linked to each of the country's ethnic groups, with the majority being Muslim Bosnians, Catholic Croats and Orthodox Christian Serbs.
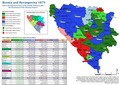
Religious structure of Bosnia and Herzegovina in 1879

Religious structure of Bosnia and Herzegovina by municipalities in 2013

Religious structure of Bosnia and Herzegovina by municipalities in 2013
Percentage of Muslims in Bosnia and Herzegovina by municipalities in 2013

Percentage of Orthodox Christians in Bosnia and Herzegovina by municipalities in 2013
Percentage of Catholics in Bosnia and Herzegovina by municipalities in 2013


Vital Statistics
Source: Statistics Agency of Bosnia and Herzegovina
| Population | Live births | Deaths | Natural change | Raw birth rate (per 1000) | Crude mortality rate (per 1000) | Natural change(per 1000) | Total fertility rate | Female fertile population (15–49 years) | |
|---|---|---|---|---|---|---|---|---|---|
| 1950 | 2,662,010 | 102.680 | 35,991 | 66.689 | 38.6 | 13.5 | 25.1 | 5.12 | 688.118 |
| 1951 | 2.721.009 | 92.330 | 46.358 | 45,972 | 33.9 | 17.0 | 16.9 | 4.53 | 711.183 |
| 1952 | 2,790,991 | 112.216 | 34.817 | 77,399 | 40.2 | 12.5 | 27.7 | 5.34 | 734.246 |
| 1953 | 2,863,124 | 110.373 | 41.199 | 69,174 | 38.5 | 14.4 | 24.2 | 4.84 | 757,312 |
| 1954 | 2,916,007 | 115.854 | 35.158 | 80.696 | 39.7 | 12.1 | 27.7 | 4.86 | 779,044 |
| 1955 | 2,973,986 | 110.866 | 40,513 | 70.353 | 37.3 | 13.6 | 23.7 | 4.46 | 800.776 |
| 1956 | 3,025,000 | 111.561 | 38.320 | 73,241 | 36.9 | 12.7 | 24.2 | 4.30 | 822.508 |
| 1957 | 3,076,006 | 102.649 | 36.830 | 65.819 | 33.4 | 12.0 | 21.4 | 3.81 | 837.959 |
| 1958 | 3,126,012 | 110.332 | 30.123 | 80,209 | 35.3 | 9.6 | 25.7 | 3.97 | 846.609 |
| 1959 | 3,185,005 | 108.123 | 32,507 | 75.616 | 33.9 | 10.2 | 23.7 | 3.94 | 827.395 |
| 1960 | 3,240,010 | 110.499 | 33,360 | 77.139 | 34.1 | 10.3 | 23.8 | 4.00 | 824.951 |
| 1961 | 3,291,684 | 108,076 | 29,413 | 78.663 | 32.8 | 8.9 | 23.9 | 3.91 | 822.510 |
| 1962 | 3,368,774 | 106.826 | 31,087 | 75.739 | 31.7 | 9.2 | 22.5 | 3.65 | 869.624 |
| 1963 | 3,444,107 | 104.239 | 29.161 | 75.078 | 30.3 | 8.5 | 21.8 | 3.56 | 871,651 |
| 1964 | 3,517,207 | 101.147 | 29.846 | 71,301 | 28.8 | 8.5 | 20.3 | 3.44 | 889.908 |
| 1965 | 3,589,486 | 101.351 | 27.814 | 73.537 | 28.2 | 7.7 | 20.5 | 3.49 | 900,857 |
| 1966 | 3,667,002 | 97.689 | 25.138 | 72,551 | 26.6 | 6.9 | 19.8 | 3.33 | 925.078 |
| 1967 | 3,735,394 | 92,972 | 26,195 | 66.777 | 24.9 | 7.0 | 17.9 | 3.12 | 955,094 |
| 1968 | 3.750.866 | 89.134 | 26,031 | 63.103 | 23.8 | 6.9 | 16.8 | 2.96 | 982,298 |
| 1969 | 3,710,120 | 87.687 | 27,805 | 59,882 | 23.6 | 7.5 | 16.1 | 2.83 | 1,020,223 |
| 1970 | 3,708,455 | 79.296 | 26,355 | 52,941 | 21.4 | 7.1 | 14.3 | 2.53 | 1,033,655 |
| 1971 | 3,759,893 | 82.694 | 24.915 | 57.779 | 22.0 | 6.6 | 15.4 | 2.83 | 986,183 |
| 1972 | 3,818,703 | 82,068 | 26.844 | 55.224 | 21.5 | 7.0 | 14.5 | 2.72 | 1.017,070 |
| 1973 | 3,871.815 | 77,896 | 24,672 | 53.224 | 20.1 | 6.4 | 13.7 | 2.50 | 1,036,884 |
| 1974 | 3,924,760 | 77,833 | 23,661 | 54,172 | 19.8 | 6.0 | 13.8 | 2.40 | 1,059,110 |
| 1975 | 3,976,913 | 78.844 | 25,571 | 53,273 | 19.8 | 6.4 | 13.4 | 2.35 | 1,083,575 |
| 1976 | 4,033,031 | 79,061 | 25.178 | 53,883 | 19.6 | 6.2 | 13.4 | 2.28 | 1,109,709 |
| 1977 | 4,085,918 | 75.669 | 24,821 | 50.848 | 18.5 | 6.1 | 12.4 | 2.13 | 1.129,991 |
| 1978 | 4,134,878 | 73,306 | 26,016 | 47.290 | 17.7 | 6.3 | 11.4 | 2.01 | 1,144,451 |
| 1979 | 4,147,344 | 71,120 | 25,370 | 45.750 | 17.1 | 6.1 | 11.0 | 1.94 | 1,145,091 |
| 1980 | 4,125,486 | 70.928 | 26.115 | 44,813 | 17.2 | 6.3 | 10.9 | 1.90 | 1,145,732 |
| 1981 | 4,136,196 | 71,031 | 26.222 | 44,809 | 17.2 | 6.3 | 10.8 | 2.03 | 1,106,551 |
| 1982 | 4,154,000 | 73,375 | 26.775 | 46,600 | 17.7 | 6.4 | 11.2 | 2.03 | 1,117,748 |
| 1983 | 4,178,000 | 74.296 | 99.9 | 44.297 | 17.8 | 7.2 | 10.6 | 2.02 | 1,132,571 |
| 1984 | 4,203,000 | 74,539 | 29,046 | 45,493 | 17.7 | 6.9 | 10.8 | 1.98 | 1,133,955 |
| 1985 | 4.227,000 | 72,722 | 28,966 | 43,756 | 17.2 | 6.9 | 10.4 | 1.91 | 1,161.934 |
| 1986 | 4.251,000 | 71.203 | 29.127 | 42,076 | 16.7 | 6.9 | 9.9 | 1.85 | 1,166,222 |
| 1987 | 4,275,000 | 70.898 | 29,382 | 41.516 | 16.6 | 6.9 | 9.7 | 1.82 | 1,174,522 |
| 1988 | 4,299,000 | 70.711 | 29,555 | 41.156 | 16.4 | 6.9 | 9.6 | 1.80 | 1,170,568 |
| 1989 | 4.323,000 | 66.809 | 30,383 | 36.426 | 15.5 | 7.0 | 8.4 | 1.70 | 1,167,038 |
| 1990 | 4.347,000 | 66,952 | 29,093 | 37.859 | 15.4 | 6.7 | 8.7 | 1.71 | 1,193.571 |
| 1991 | 4,377,033 | 65.430 | 31.411 | 34,019 | 14.9 | 7.2 | 7.8 | 1.89 | 1,100.615 |
| 1992(1) | |||||||||
| 1993(1) | |||||||||
| 1994(1) | |||||||||
| 1995(1) | |||||||||
| 1996 | 3,530,799 | 46,594 | 25,152 | 21,442 | 13.2 | 7.1 | 6.1 | 1.93 | 863,535 |
| 1997 | 3,529,909 | 48,061 | 27.875 | 20.186 | 13.6 | 7.9 | 5.7 | 2.00 | 863,273 |
| 1998 | 3,529,573 | 45,007 | 28.679 | 16,328 | 12.8 | 8.1 | 4.6 | 1.87 | 863,131 |
| 1999 | 3,527,549 | 42,464 | 28.637 | 13,827 | 12.0 | 8.1 | 3.9 | 1.76 | 862,607 |
| 2000 | 3,524,627 | 39,563 | 30,482 | 9,081 | 11.2 | 8.6 | 2.6 | 1.64 | 861,884 |
| 2001 | 3,521,310 | 37.717 | 30.325 | 7,392 | 10.7 | 8.6 | 2.1 | 1.57 | 861,073 |
| 2002 | 3,517,955 | 36,485 | 30.831 | 5,654 | 10.4 | 8.8 | 1.6 | 1.51 | 860.588 |
| 2003 | 3,514,019 | 34,691 | 32,018 | 2,673 | 9.9 | 9.1 | 0.8 | 1.44 | 859.706 |
| 2004 | 3,509,542 | 33,862 | 32,223 | 1.639 | 9.6 | 9.2 | 0.5 | 1.42 | 853,854 |
| 2005 | 3,505,037 | 33,233 | 33.925 | - 692 | 9.5 | 9.7 | -0.2 | 1.40 | 848,006 |
| 2006 | 3,501,621 | 33,038 | 32,652 | 386 | 9.4 | 9.3 | 0.1 | 1.39 | 847.935 |
| 2007 | 3,498,023 | 32,801 | 34,392 | -1,591 | 9.4 | 9.8 | -0.5 | 1.38 | 847.820 |
| 2008 | 3,493,737 | 34,023 | 33,871 | 152 | 9.7 | 9.7 | 0.0 | 1.43 | 847.785 |
| 2009 | 3,491,327 | 34.449 | 34,709 | -260 | 9.9 | 9.9 | -0.1 | 1.44 | 847,332 |
| 2010 | 3,488,441 | 33.445 | 34,905 | -1,460 | 9.6 | 10.0 | -0.4 | 1.40 | 849,272 |
| 2011 | 3,484,154 | 31,694 | 34.820 | -3,126 | 9.1 | 10.0 | -0.9 | 1.32 | 847,004 |
| 2012 | 3,479,234 | 32.414 | 35,578 | -3,164 | 9.3 | 10.2 | -0.9 | 1.37 | 837,868 |
| 2013 | 3,473,720 | 30,551 | 35,379 | -4,828 | 8.8 | 10.2 | -1.4 | 1.30 | 821,886 |
| 2014 | 3,466,388 | 30.134 | 35,692 | -5,558 | 8.7 | 10.3 | -1.6 | 1.30 | 820.215 |
| 2015 | 3,456,394 | 29.647 | 37,876 | -8,229 | 8.6 | 11.0 | -2.4 | 1.28 | 810.205 |
| 2016 | 3,447,001 | 29,985 | 36,065 | -6,080. | 8.7 | 10.5 | -1.8 | 1.30 | 806,221 |
| 2017 | 3,437,453 | 30,061 | 37,453 | -7,392 | 8.7 | 10.9 | -2.2 | 1.31 | 798.190 |
| 2018 | 3,427,369 | 29.328 | 37.237 | -7,909 | 8.6 | 10.9 | -2.3 | 1.29 | 789.815 |
| 2019 | 3,415,752 | 28,192 | 38.237 | -10,045 | 8.3 | 11.2 | -2.9 | 1.26 | 782,369 |
| 2020 | 3,403,638 | 27.156 | 43,808 | -16,652 | 8.0 | 12.9 | -4.9 | 1.23 | 772,876 |