Demographics of Afghanistan
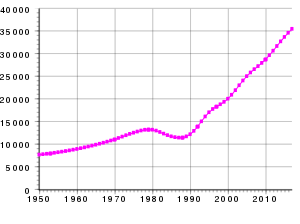
The population of Afghanistan is divided into a large number of ethnic groups. Since no systematic census has been carried out in the country in recent times, exact figures on the size and composition of the various ethnic groups are not available. Therefore, most of the figures are only approximations.
Population
Total population
40 754 385 (2022)
Projections
- Year 2030: 48 093 575
- Year 2040: 56 912 008
- Year 2050: 64 682 976
- Year 2060: 70 844 693
- Year 2070: 74 975 404
- Year 2080: 76 870 228
- Year 2090: 76 692 975
- Year 2100: 74 937 961
Source: Afghanistan - Population 1950 - 2100
Demographic evolution
- 1890: 4 million.
- 1900: 3.7 million.
- 1914: 6 million.
- 1947: 11 million.
- 1956: 13 million.
- 1976: 17 million.
- 1989: 15 million.
- 1996: $24.2 million.
- 2000: 25.8 million.
- 2016 grid 27.6 million.
Population by Province Rural Urban
| Province | Capital | Rural population | Urban population | % Population | Total Rural and Urban | Area (km2) | Density | Districts | |||||||
| Women | Men | Total | Women | Men | Total | Rural | Urban | Men | Women | Total | |||||
| Badahšan | Fayzābād | 455.441 | 472.883 | 928.324 | 18.770 | 19,695 | 38.465 | 96.02 | 3,98 | 492.578 | 474.211 | 966.789 | 44,059 | 22 | 29 |
| Bādgīs | Qal'eh-ye Now | 239.064 | 249.920 | 488.984 | 7.402 | 7.799 | 15.201 | 96.99 | 3,01 | 257.719 | 246.466 | 504.185 | 20,591 | 24 | 7 |
| Ba ' | Puli Khumri | 358.962 | 378.721 | 737.683 | 92.925 | 96.361 | 189.286 | 79.58 | 20,42 | 475.082 | 451.887 | 926.969 | 21,118 | 44 | 16 |
| Balh | Mazari Sharif | 415.435 | 433.121 | 848.556 | 245.755 | 259.315 | 505.070 | 62,69 | 37,31 | 692.436 | 661.190 | 1.353.626 | 17,249 | 78 | 15 |
| Bāmiyān | Bamiyán | 217.597 | 223.818 | 441.415 | 6.609 | 6.609 | 13.218 | 97.09 | 2.91 | 230.427 | 224.206 | 454.633 | 14,175 | 32 | 7 |
| Daikondi | Nili | 225.891 | 238.454 | 464.345 | 1.851 | 1.982 | 3.833 | 99.18 | 0.82 | 240.436 | 227.742 | 468.178 | 18,088 | 26 | 84 |
| Farāh | Farāh | 232.843 | 244.797 | 477.640 | 18.506 | 19.827 | 38.333 | 92.57 | 7.43 | 264.624 | 251.349 | 515.973 | 48,471 | 11 | 11 |
| Fāryāb | Maymanah | 435.560 | 454.466 | 890.026 | 61.597 | 63.712 | 125.309 | 87.66 | 12,34 | 518.178 | 497.157 | 1.015.335 | 20,293 | 50 | 14 |
| latitudeaznī | latitudeaznī | 580.706 | 606.808 | 1.187.514 | 30.270 | 31.592 | 61.862 | 95.05 | 4.95 | 638,400 | 610.976 | 1.249.376 | 22.915 | 55 | 19 |
| latitudeawr | Ča preparednessčarān | 339.690 | 354.693 | 694.383 | 3.569 | 3.701 | 7.270 | 98.96 | 1.04 | 358.394 | 343.259 | 701.653 | 36.479 | 19 | 10 |
| Jost | Jost | 279.193 | 292.853 | 572.046 | 5.816 | 6.213 | 12.029 | 97.94 | 2.06 | 299.066 | 285.009 | 584.075 | 4,152 | 141 | 13 |
| Helmand | Lashkar Gah | 430.681 | 453.246 | 883.927 | 26.833 | 29.477 | 56.310 | 94.01 | 5,99 | 482.723 | 457.514 | 940.237 | 58,584 | 16 | 13 |
| Herāt | Herāt | 675.112 | 691.456 | 1.366.568 | 276.337 | 285.422 | 561.759 | 70.87 | 29.13 | 976.878 | 951.449 | 1.928.327 | 54.778 | 35 | 15 |
| Jawzjān | Šibar emerging | 211.498 | 219.305 | 430.803 | 58.557 | 60.540 | 119.097 | 78.34 | 21.66 | 279.845 | 270.055 | 549.900 | 11,798 | 47 | 9 |
| Kabul | Kabul | 334.324 | 349.814 | 684.138 | 1.852.243 | 1.987.337 | 3.839.580 | 15.12 | 84.88 | 2.337.151 | 2.186.567 | 4.523.718 | 4,462 | 1.014 | 15 |
| Kandahar | Kandahar | 392.626 | 411.898 | 804.524 | 217.518 | 230.744 | 448.262 | 64.22 | 35,78 | 642.642 | 610.144 | 1.252.786 | 54,022 | 23 | 16 |
| Kāpīsā | Mahmud-i-Raqi | 221.378 | 225.281 | 446.659 | 661 | 925 | 1.586 | 99.65 | 0.35 | 226.206 | 222.039 | 448.245 | 1,842 | 243 | 7 |
| Kunar | Asadabad | 216.743 | 227.111 | 443.854 | 6.874 | 7.402 | 14.276 | 96.88 | 3.12 | 234.513 | 223.617 | 458.130 | 4,942 | 93 | 15 |
| The schooling | Mehtar Lam | 218.329 | 229.306 | 447.635 | 2.511 | 2.776 | 5.287 | 98.83 | 1,17 | 232.082 | 220.840 | 452.922 | 3,843 | 118 | 5 |
| Lawgar | Pul-i-Alam | 190.763 | 197.594 | 388.357 | 5.023 | 5.155 | 10.178 | 97.45 | 2.55 | 202.749 | 195.786 | 398.535 | 3,880. | 103 | 7 |
| Nangarhar | Jalālābād | 639.008 | 668.648 | 1.307.656 | 115.379 | 122.413 | 237.792 | 84.61 | 15,39 | 791.061 | 754.387 | 1.545.448 | 7.727 | 200 | 23 |
| Nimruz | Zaranj | 68.670 | 79.963 | 148.633 | 13.351 | 13.879 | 27.230 | 84,52 | 15,48 | 93.842 | 82.021 | 175.863 | 41,005 | 4 | 5 |
| Nūristān | Parun | 73.671 | 76.720 | 150.391 | -- | -- | -- | -- | -- | 76.720 | 73.671 | 150.391 | 9,225 | -- | 7 |
| Paktiyā | Gardez | 261.873 | 273.948 | 535.821 | 12.425 | 12.954 | 25.379 | 95.48 | 4.52 | 286. | 274.298 | 561.200 | 6,432 | 87 | 11 |
| Paktīkā | Sharan | 213.816 | 225.159 | 438.975 | 1.322 | 1.586 | 2.908 | 99.34 | 0.66 | 226.745 | 215.138 | 441.883 | 19,482 | 23 | 15 |
| Panjshīr | Bazarak | 76.232 | 79.769 | 156.001 | -- | -- | -- | -- | -- | 79.769 | 76.232 | 156.001 | 3.610 | -- | 55 |
| Parvān | Charikar | 303.831 | 311.027 | 614.858 | 30.138 | 30.799 | 60.937 | 90.98 | 9,02 | 341.826 | 333.969 | 675.795 | 5,974 | 113 | 9 |
| Qundūz | Qundūz | 377.014 | 388.113 | 765.127 | 128.485 | 135.861 | 264.346 | 74.32 | 25,68 | 523.974 | 505.499 | 1.029.473 | 8,040 | 128 | 7 |
| Samangān | Aybak | 177.347 | 186.738 | 364.085 | 15.201 | 15.201 | 30.402 | 92.29 | 7.71 | 201.939 | 192.548 | 394.487 | 11,262 | 35 | 5 |
| Sar-e Pul | Sar-e Pul | 256.018 | 268.215 | 524.233 | 21.678 | 23.132 | 44.810 | 92.13 | 7.87 | 291.347 | 277.696 | 569.043 | 16,360 | 35 | 6 |
| Tahār | Taloqan | 424.583 | 442.512 | 867.095 | 65.563 | 67.678 | 133.241 | 86.68 | 13,32 | 510.190 | 490.146 | 1,000,336 | 12,333 | 81 | 12 |
| Urūzgān | Tarin Kowt | 167.711 | 178.078 | 345.789 | 5.155 | 5.420 | 10.575 | 97.03 | 2.97 | 183.498 | 172.866 | 356.364 | 12.696 | 28 | 6 |
| Vardak | Meydan Shahr | 295.171 | 307.734 | 602.905 | 1.586 | 1.586 | 3.172 | 99.48 | 0.52 | 309.320 | 296.757 | 606.077 | 9,934 | 61 | 9 |
| Zābul | Qalat | 144.536 | 152.099 | 296.635 | 6.080 | 6.477 | 12.557 | 95.94 | 4.06 | 158.576 | 150.616 | 309.192 | 17,343 | 18 | 9 |
| Totals | 10.151.317 | 10.594.268 | 20.745.585 | 3.355.990 | 3.563.570 | 6.919.560 | 74.99 | 25,01 | 14.157.838 | 13.507.307 | 27.665.145 | 647,164 | 43 | 506 | |
Ethnic groups
In Afghanistan there is a large number of ethnic groups, unfortunately due to the great political instability that the country has, it is difficult to make precise estimates. According to the CIA World FactBook (for 2005), the distribution of ethnic groups is as follows: Pashtun 42%, Tajik 27%, Hazara 9%, Uzbek 9%, Aimak 4%, Turkmen 3%, Baluchis 2%, others 4%. Based on Afghan government sources, the evolution of the different ethnic groups prior to 2004 until 2020 is described below.
The recent estimates described above are also supported by some national surveys, which helped to find out how a group of 804 to 8,706 residents of the country felt about the war, the political situation, as well as about the problems socioeconomic factors that affected the day to day. Ten surveys were carried out between 2004-2015 by the Asia Foundation and one between 2004-2009 by some companies such as NBC, BBC and ARD.
Religion
Religiously, Afghans are predominantly Muslim (approximately 80% Sunni and 19% Shia). There are also Hindu and Sikh minorities. A millennial Jewish population has been reduced to a single permanent inhabitant for some years. Many of these fled during the civil war in the 1990s to neighboring countries and to Europe and America. With the fall of the Taliban, some Sikhs have returned to Ghazni province.
Languages
The official languages of Afghanistan are Afghan Persian or Dari 50% and Pashtu 35%. Other languages include Turkic languages (mainly Uzbek and Turkmen) 11%, 30 minor languages (mainly Baluchi and Pashai) 4%. Also a small number of ethnic minorities, mainly Sikhs and Hindus, speak Punjabi. Bilingualism is also common.
Contenido relacionado
114
77
Jackson Day


